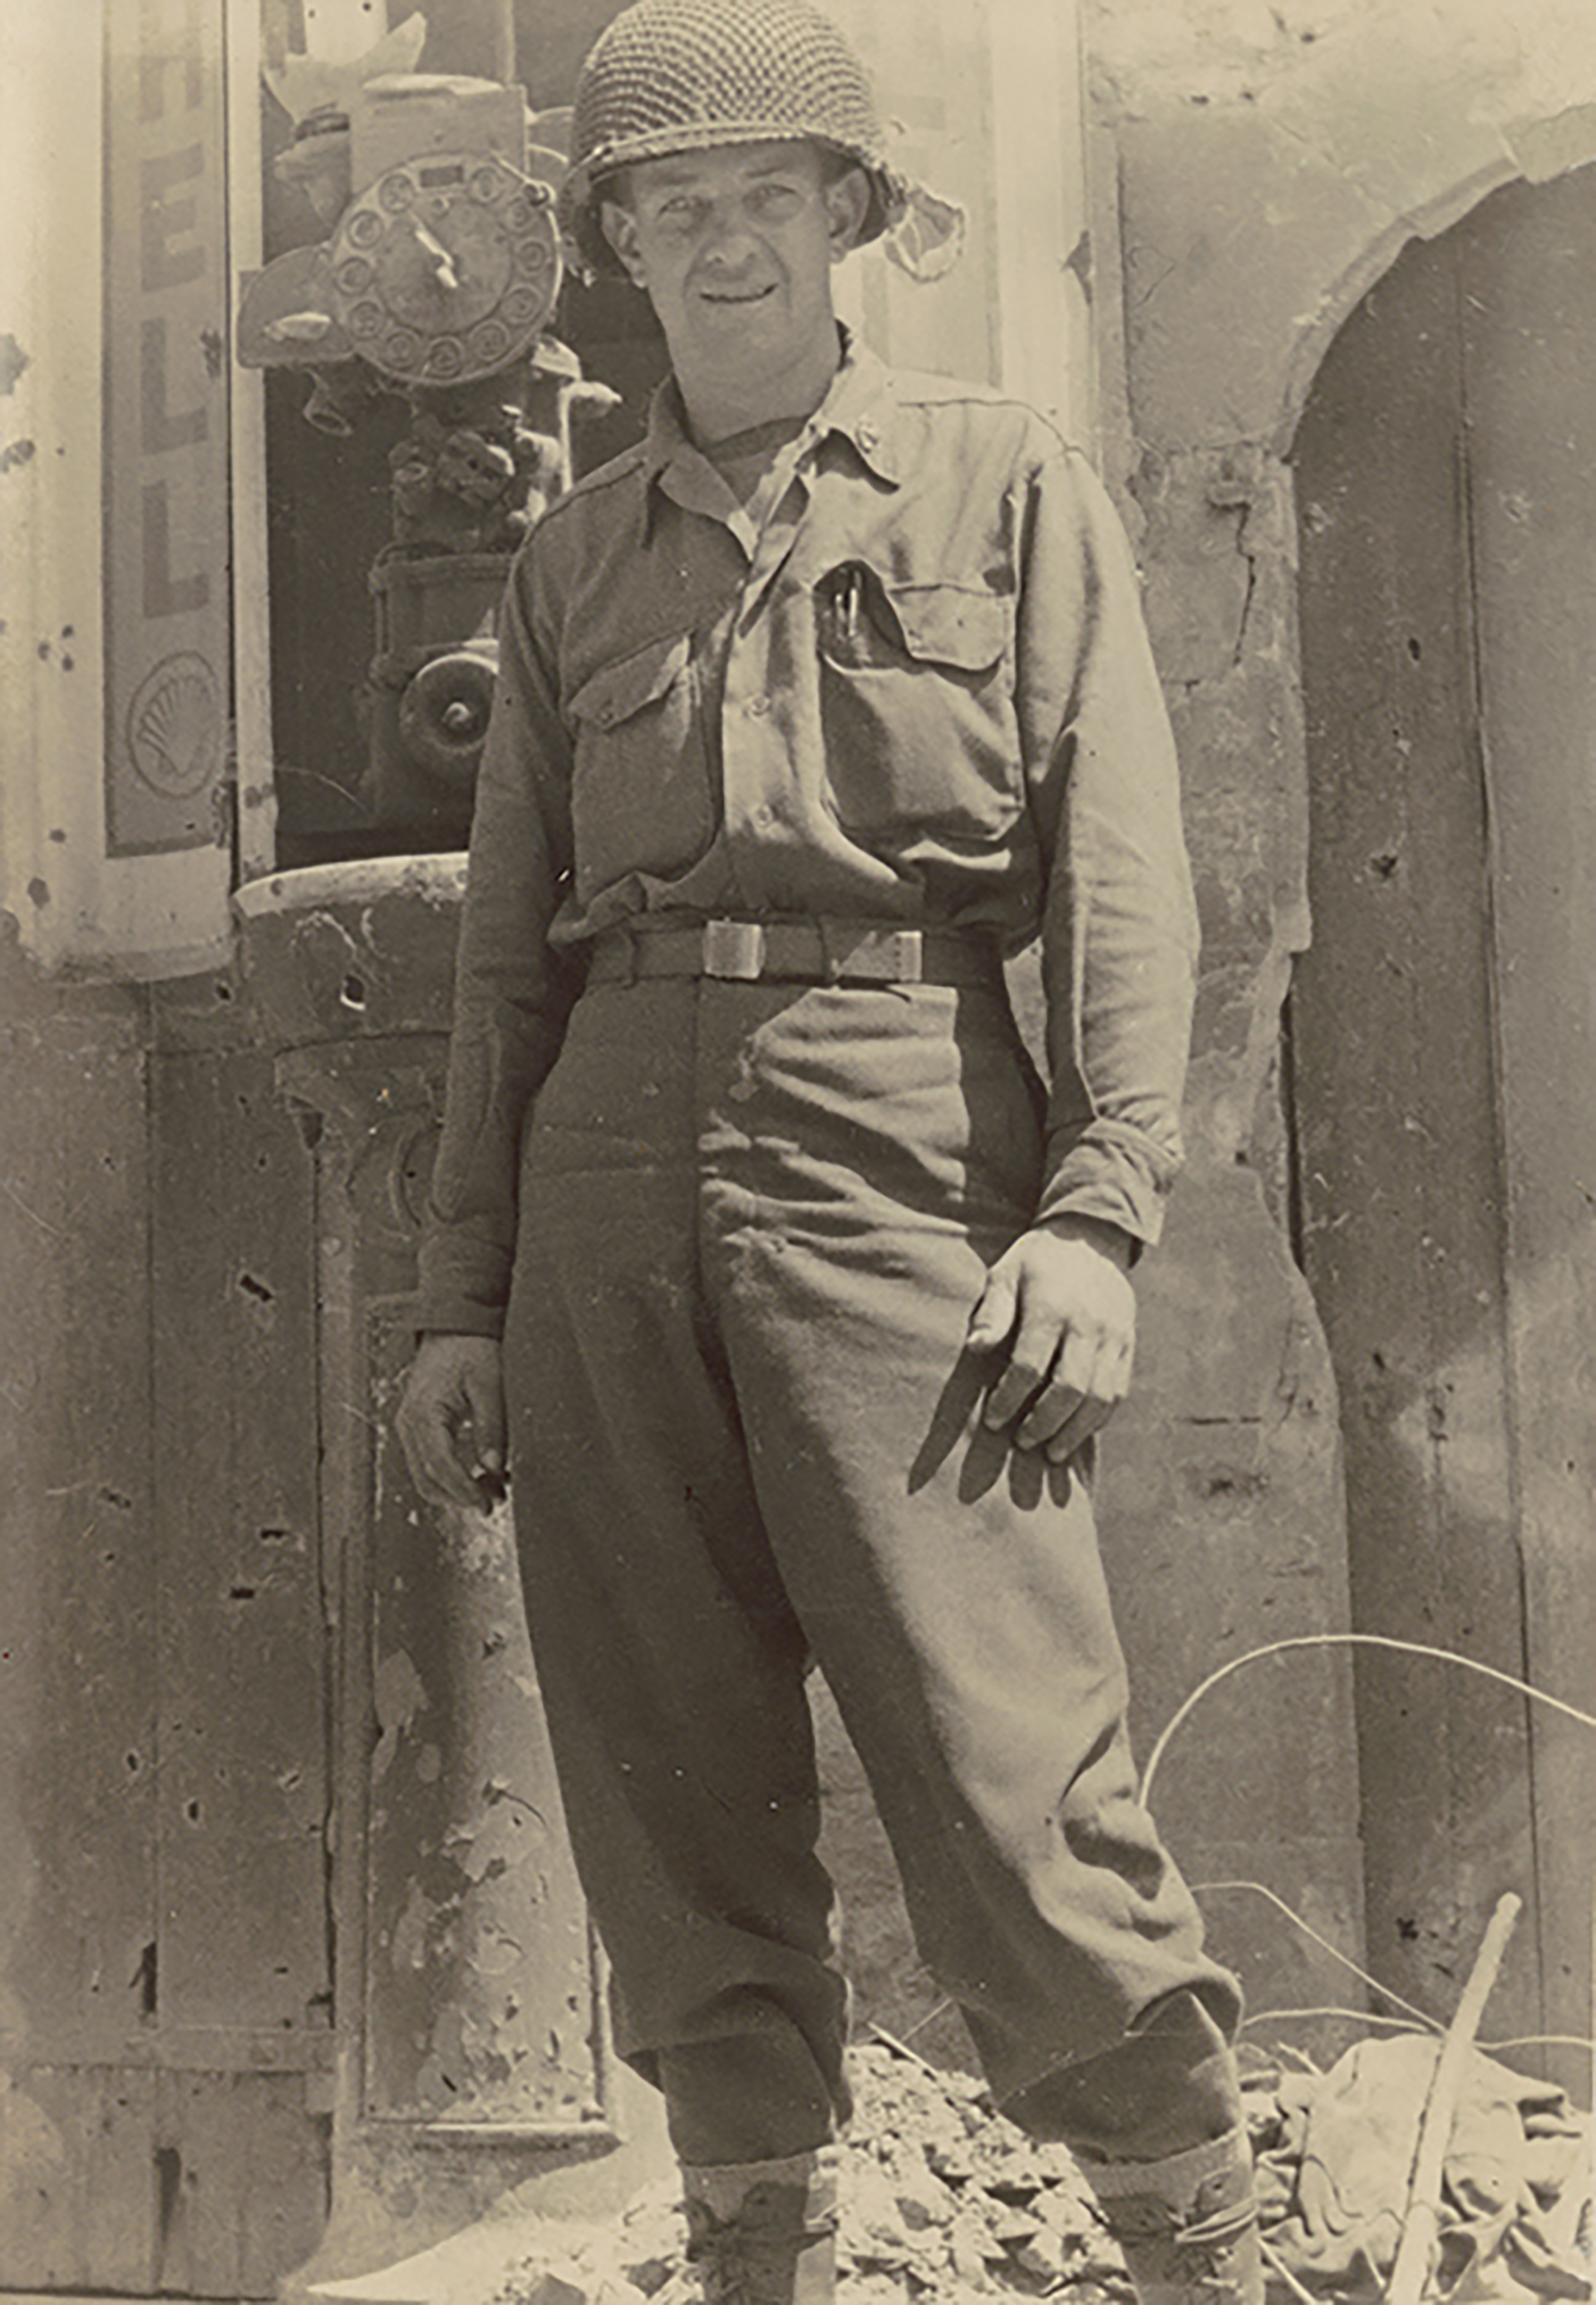
The notoriety of the online Perry-Castañeda Library Map Collection has afforded us many amazing gifts. Two recent gifts are particularly notable. The family of UT alumni Roy J. Beery graciously gifted us with the maps he used when he served in the World War II Invasion of Normandy. And the Army Heritage Center gifted maps and other materials that Colonel Roland T. Fenton, who served in machine gun battalions in World War I and World War II, used during his service. The fact that these maps survived the treacheries of war is amazing. We are lucky to be able to preserve and share them with generations to come.
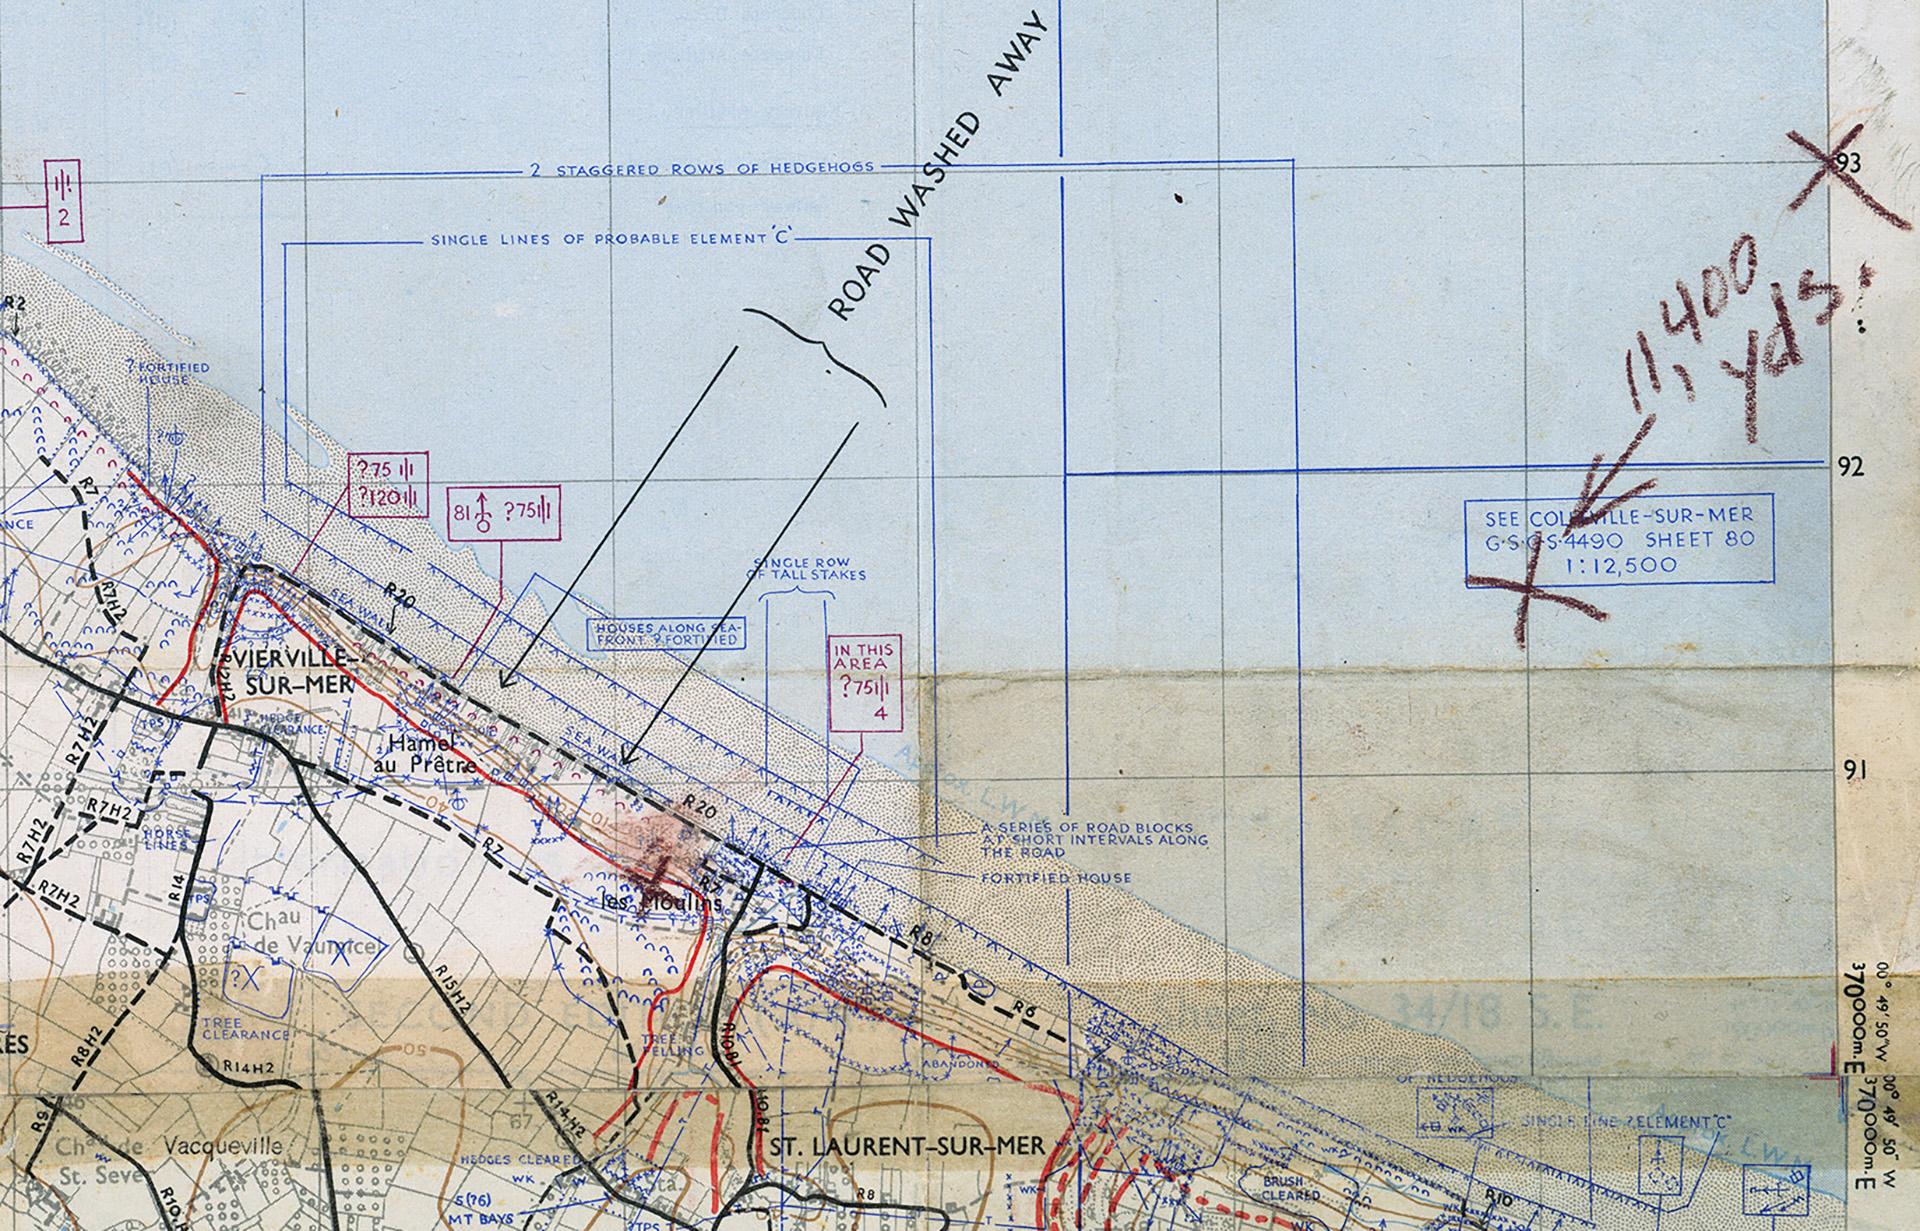
Generally we hope for maps in pristine condition, but in this case the wear and writing are an important part of the story. This is the map used by U.S. Navy, Lieutenant Commander Roy Beery while on sea duty in the Atlantic amphibious force during the assault on the Coast of Normandy, France.
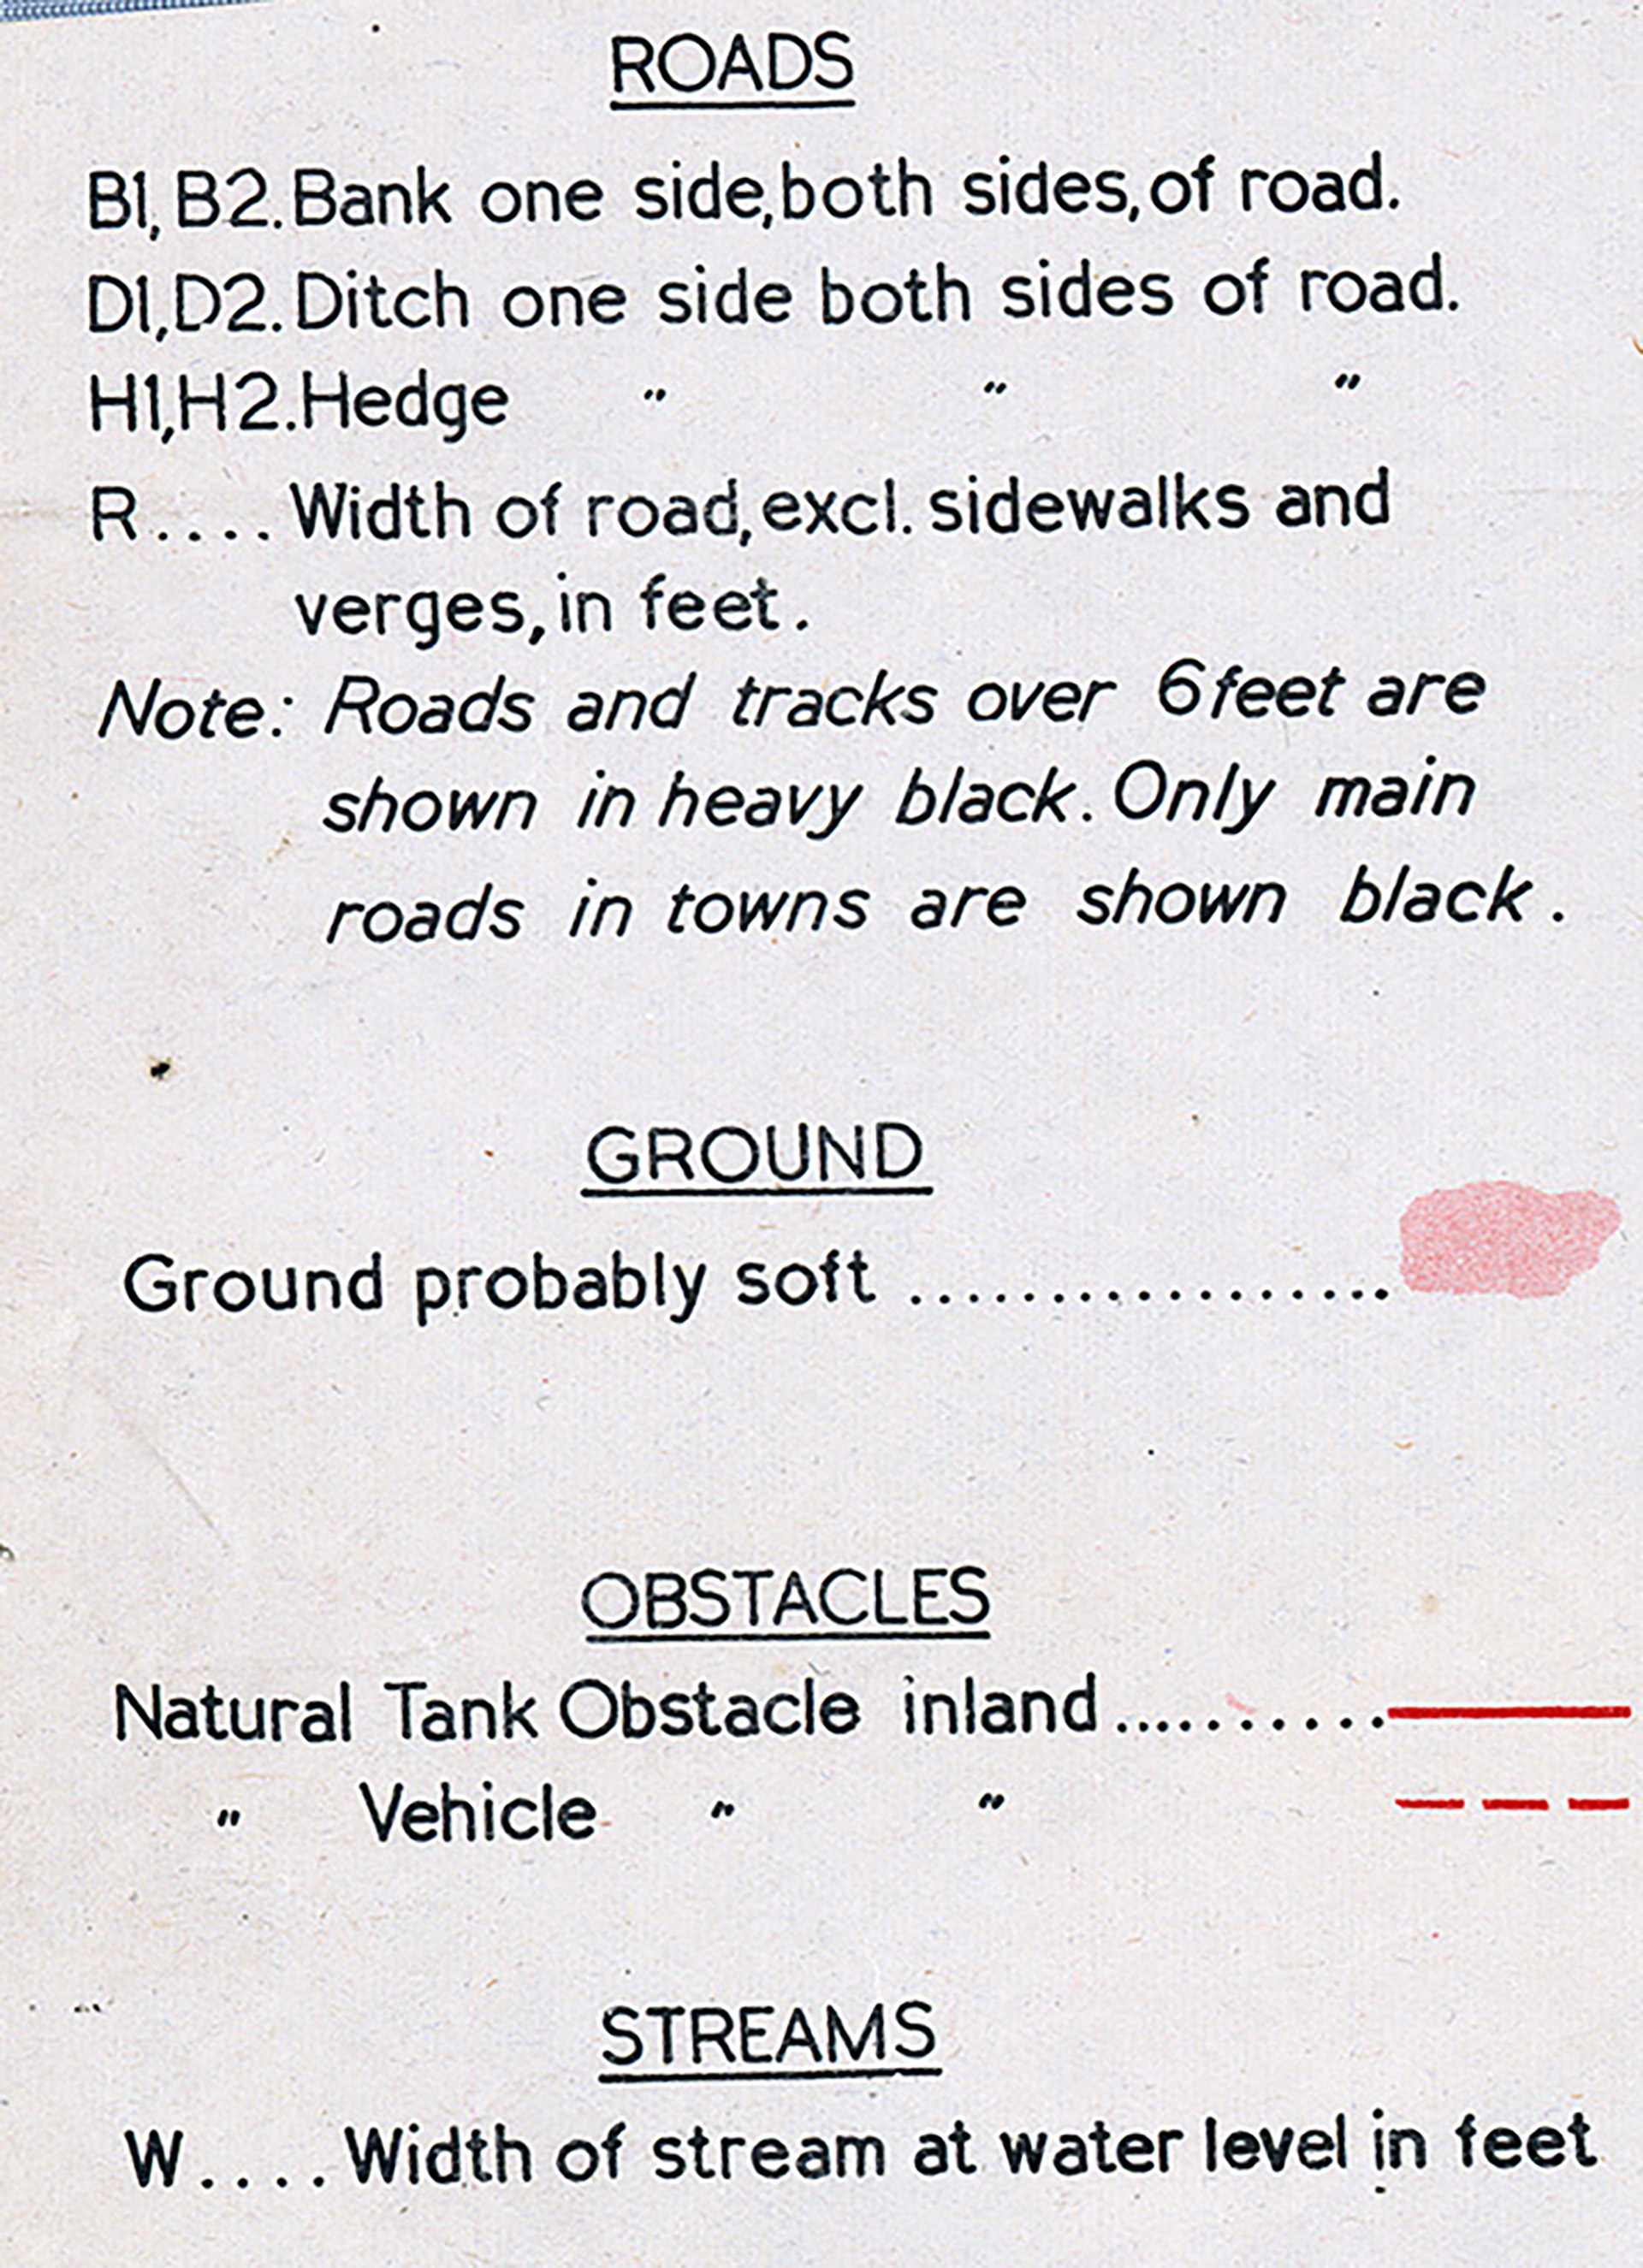
Map used by U.S. Navy, Lieutenant Commander Roy Beery while on sea duty in the Atlantic amphibious force during the assault on the Coast of Normandy, France.(Detail) This detail not only shows the strategic overprint it has handwritten notes, presumably Lt. Commander Beery’s. Notice all of the overprint information specific to the invasion and ground combat.(Detail) It was made by the British War Office’s Geographical Section, General Staff (G.S.G.S.). Note the parts of the legend that are specific to combat.
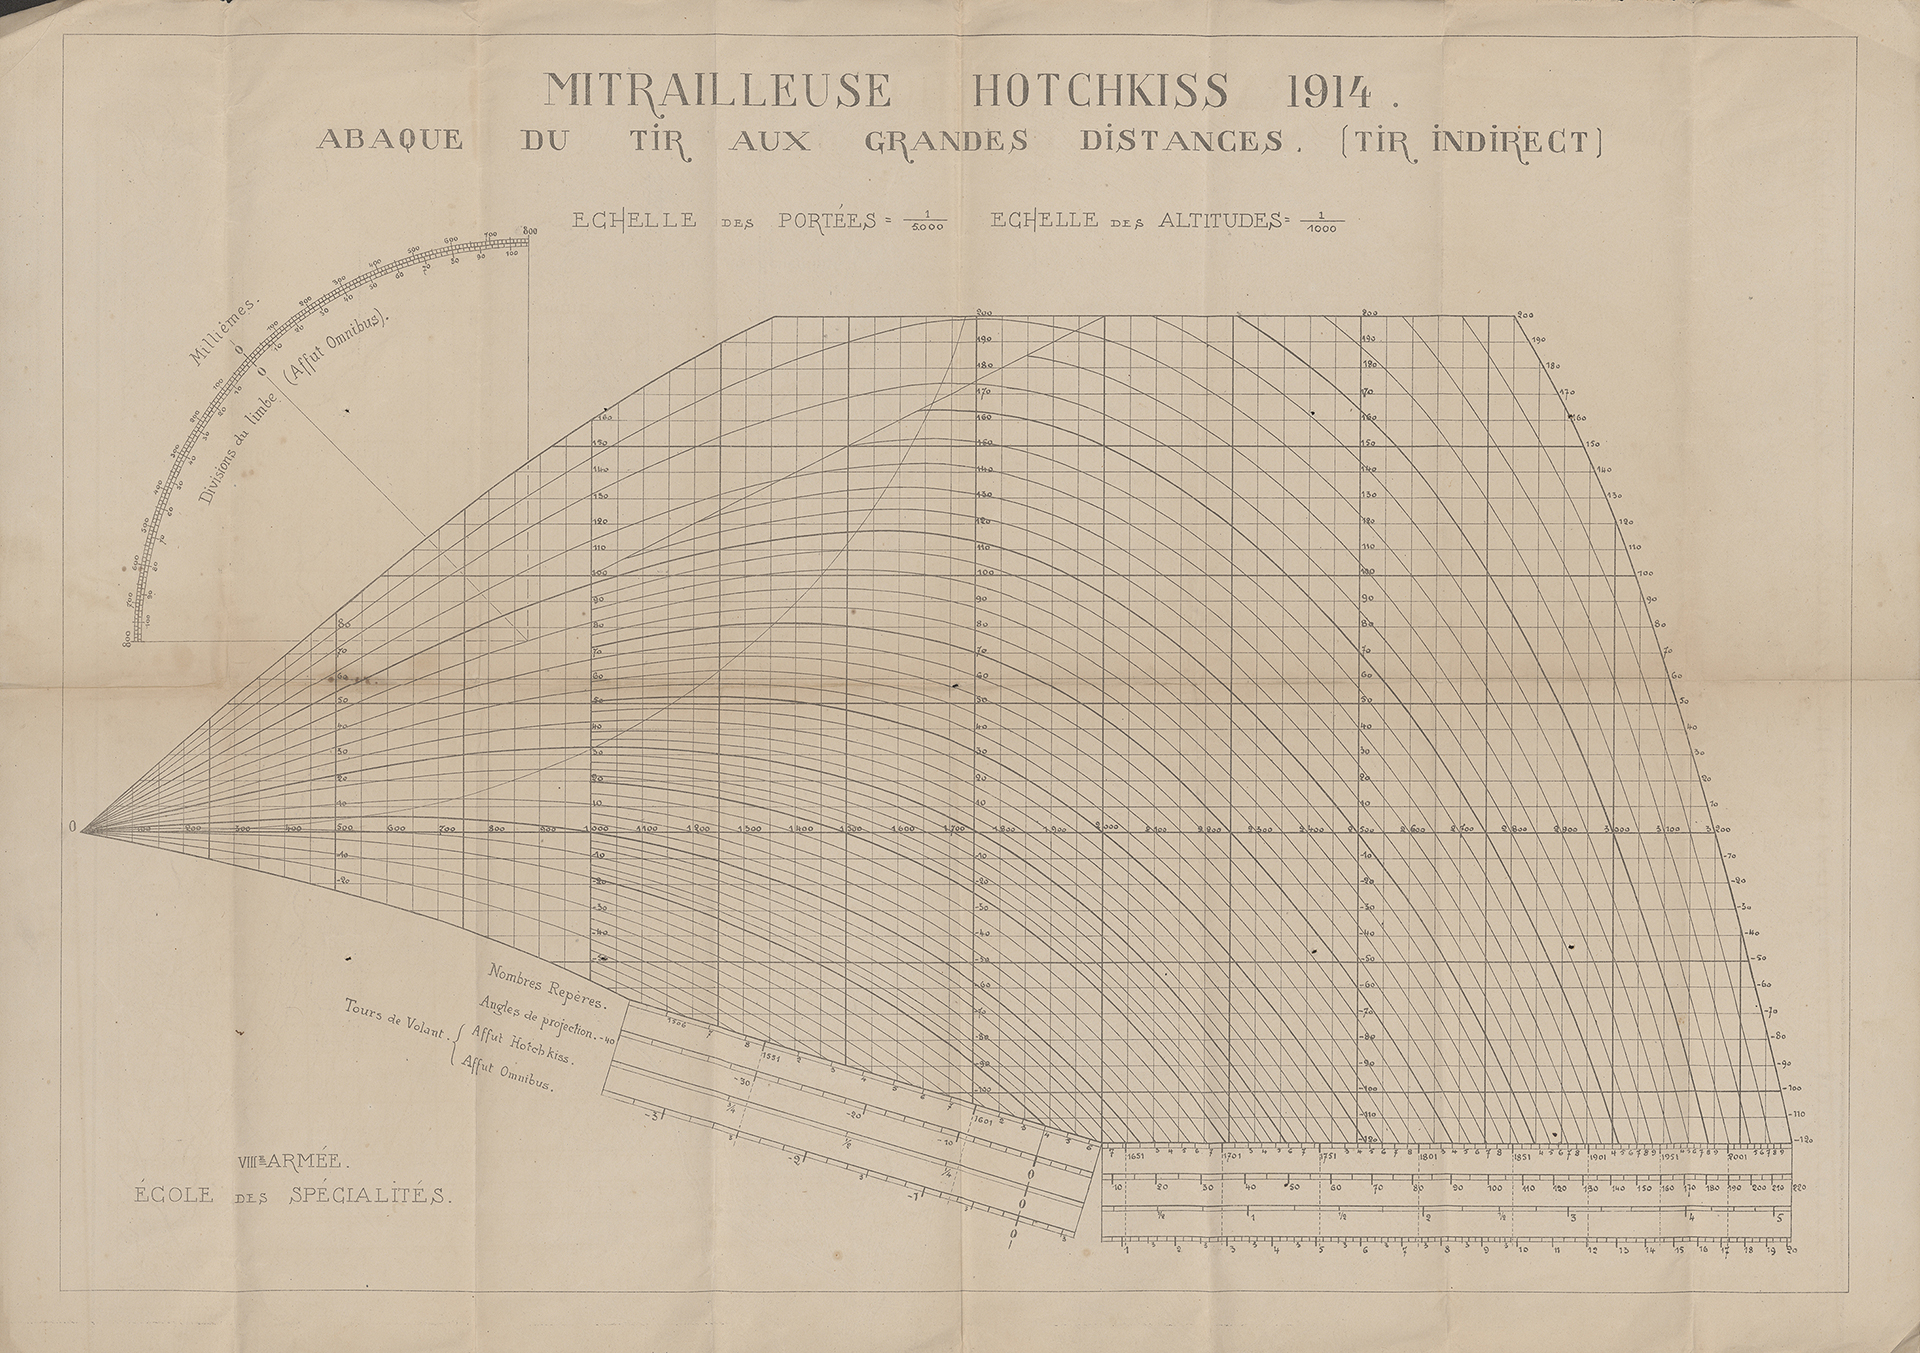
As part of the 103rd Machine Gun Battalion, (then) Lt. Fenton was on the front lines of WWI. The gift materials that belonged to him consist of trench maps, front line maps, and the following long distance firing range calculator for Hotchkiss machine gun.
Long distance firing range calculator for Hotchkiss machine gun.
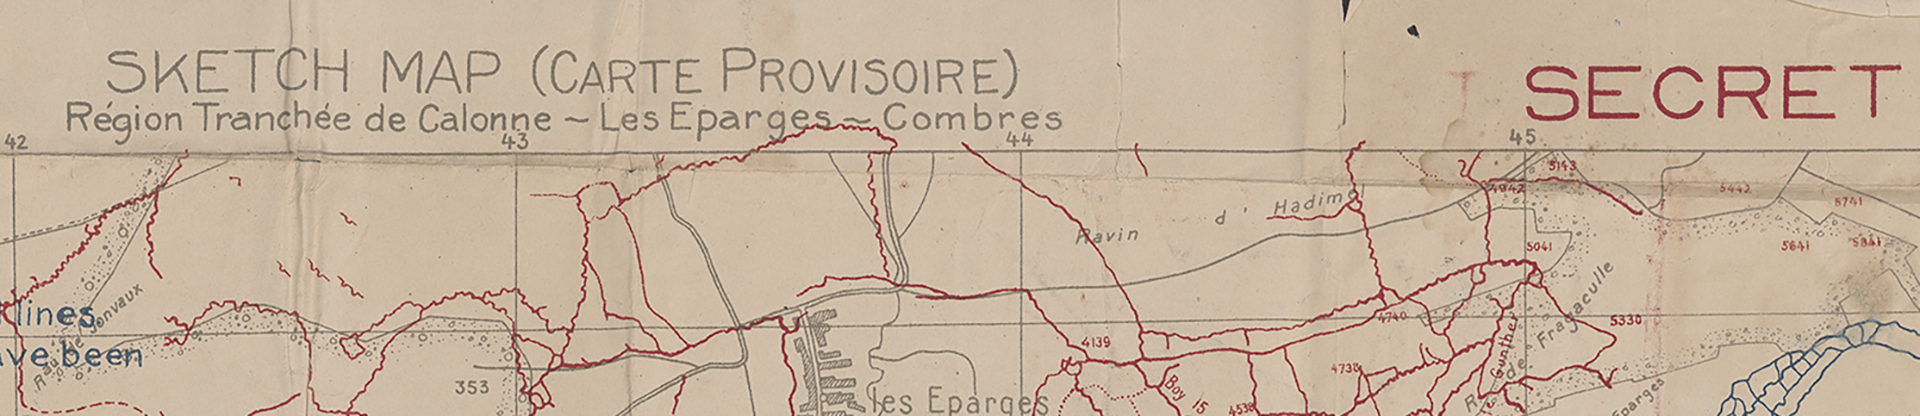
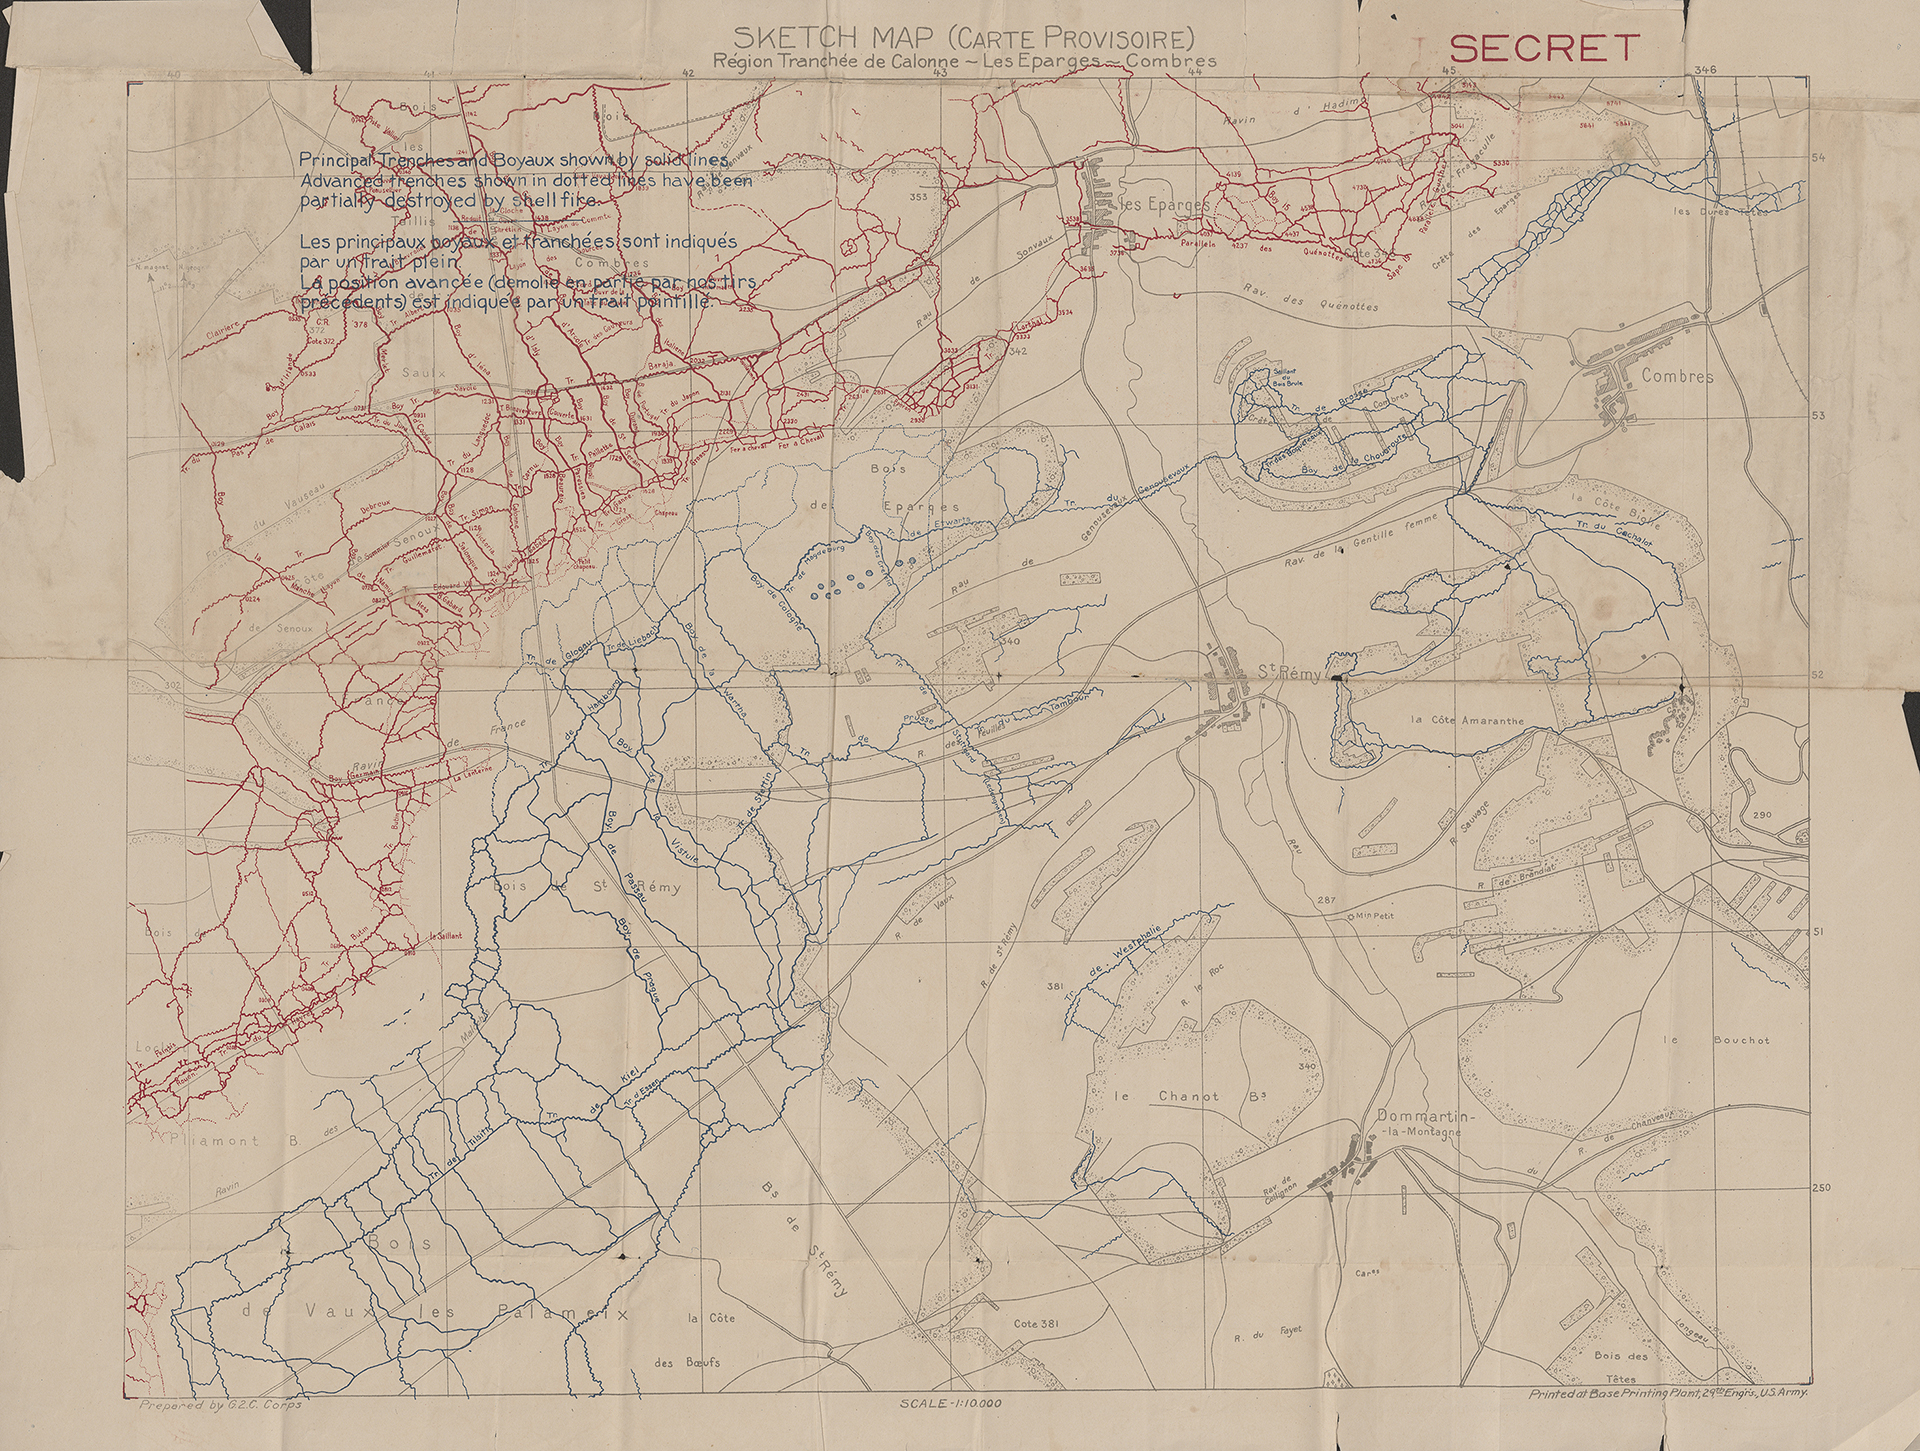
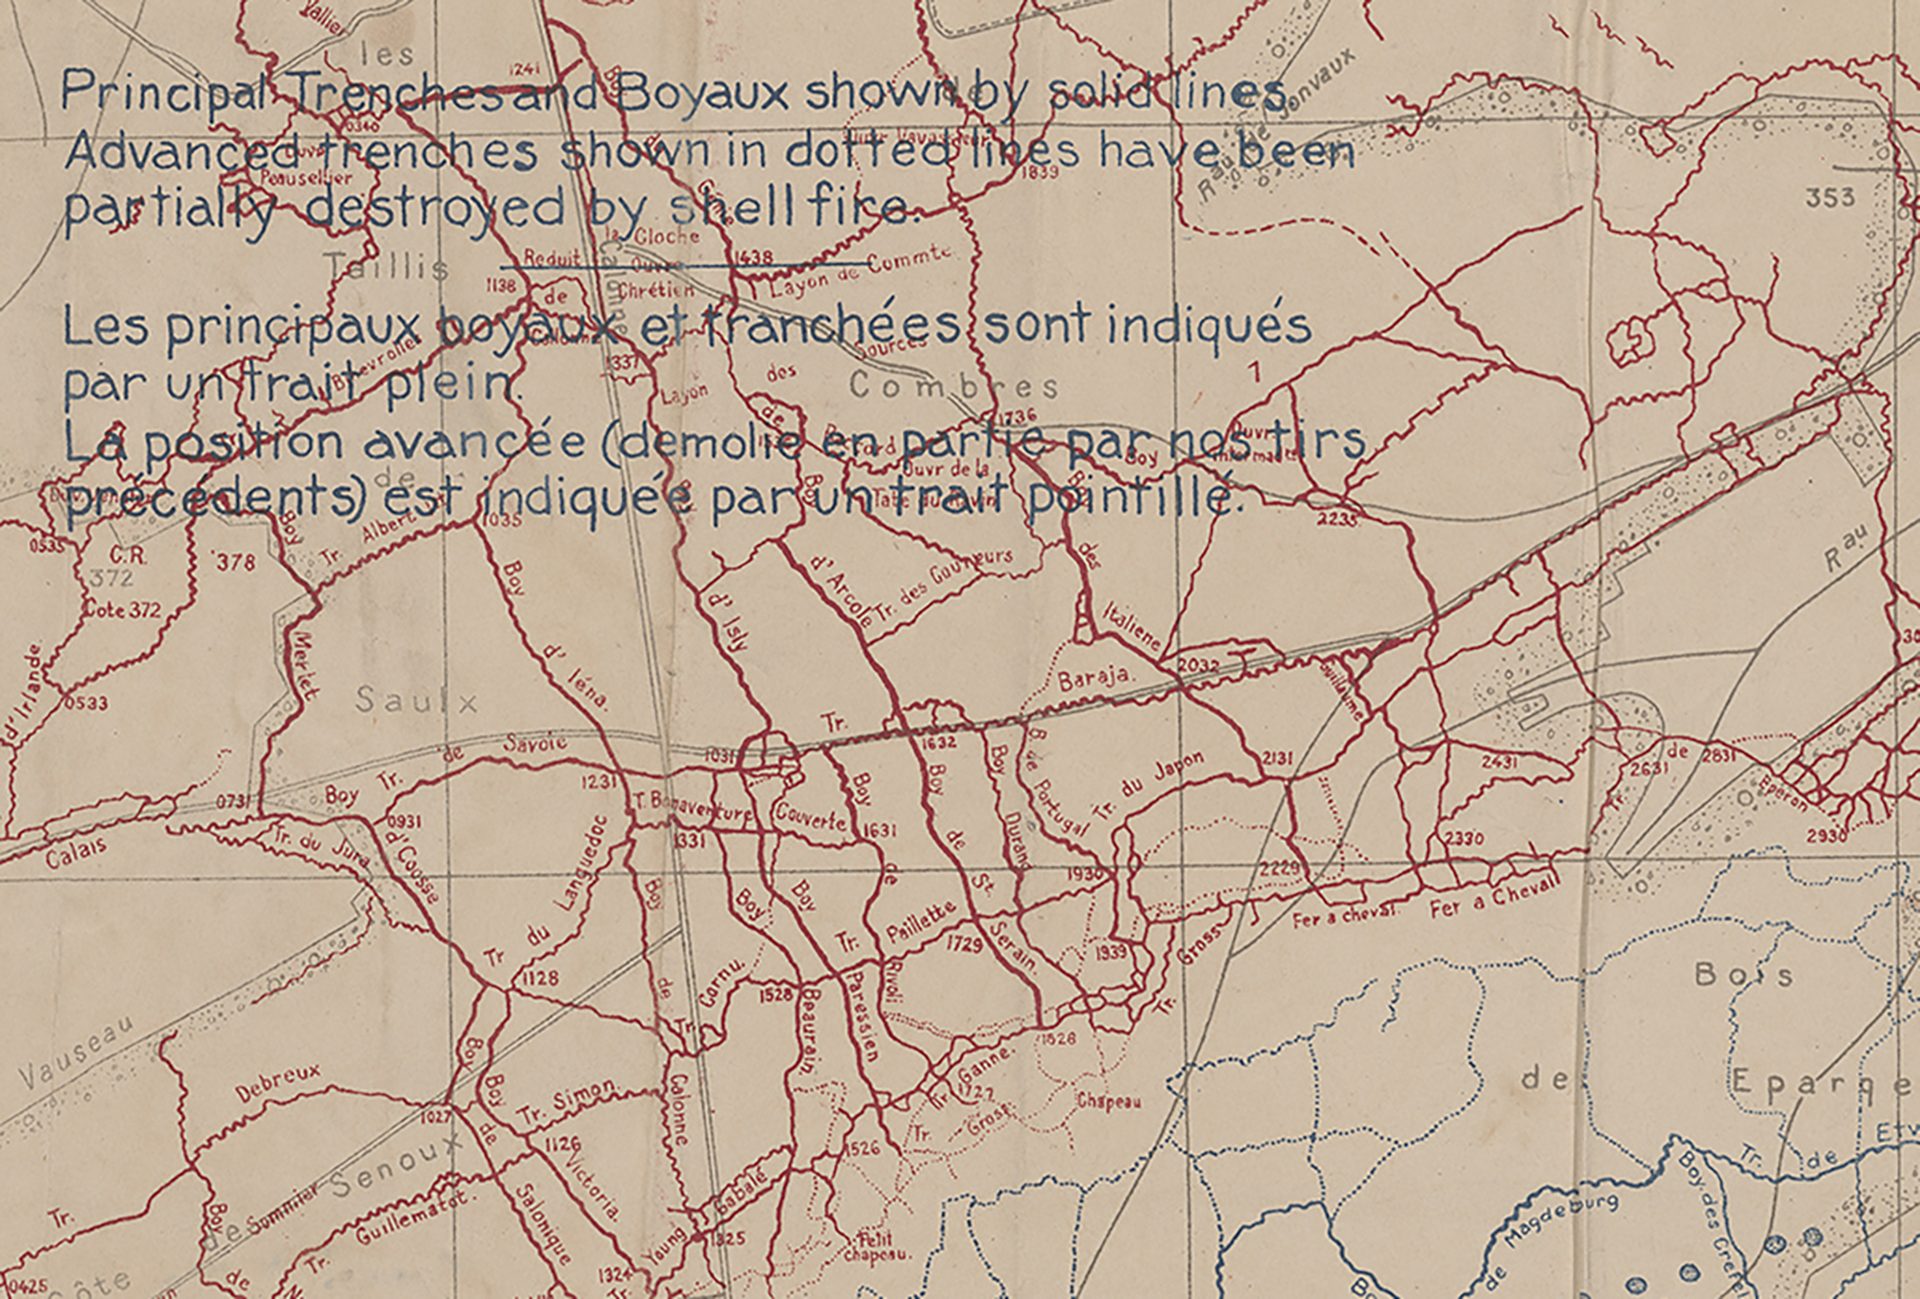
This Sketch Map shows the trenches in the Meuse region of France. The red represents the Allied Forces and the blue German.
Sketch Map of the trenches in the Meuse region of France.(Detail) There’s just one paragraph explaining what the lines mean.
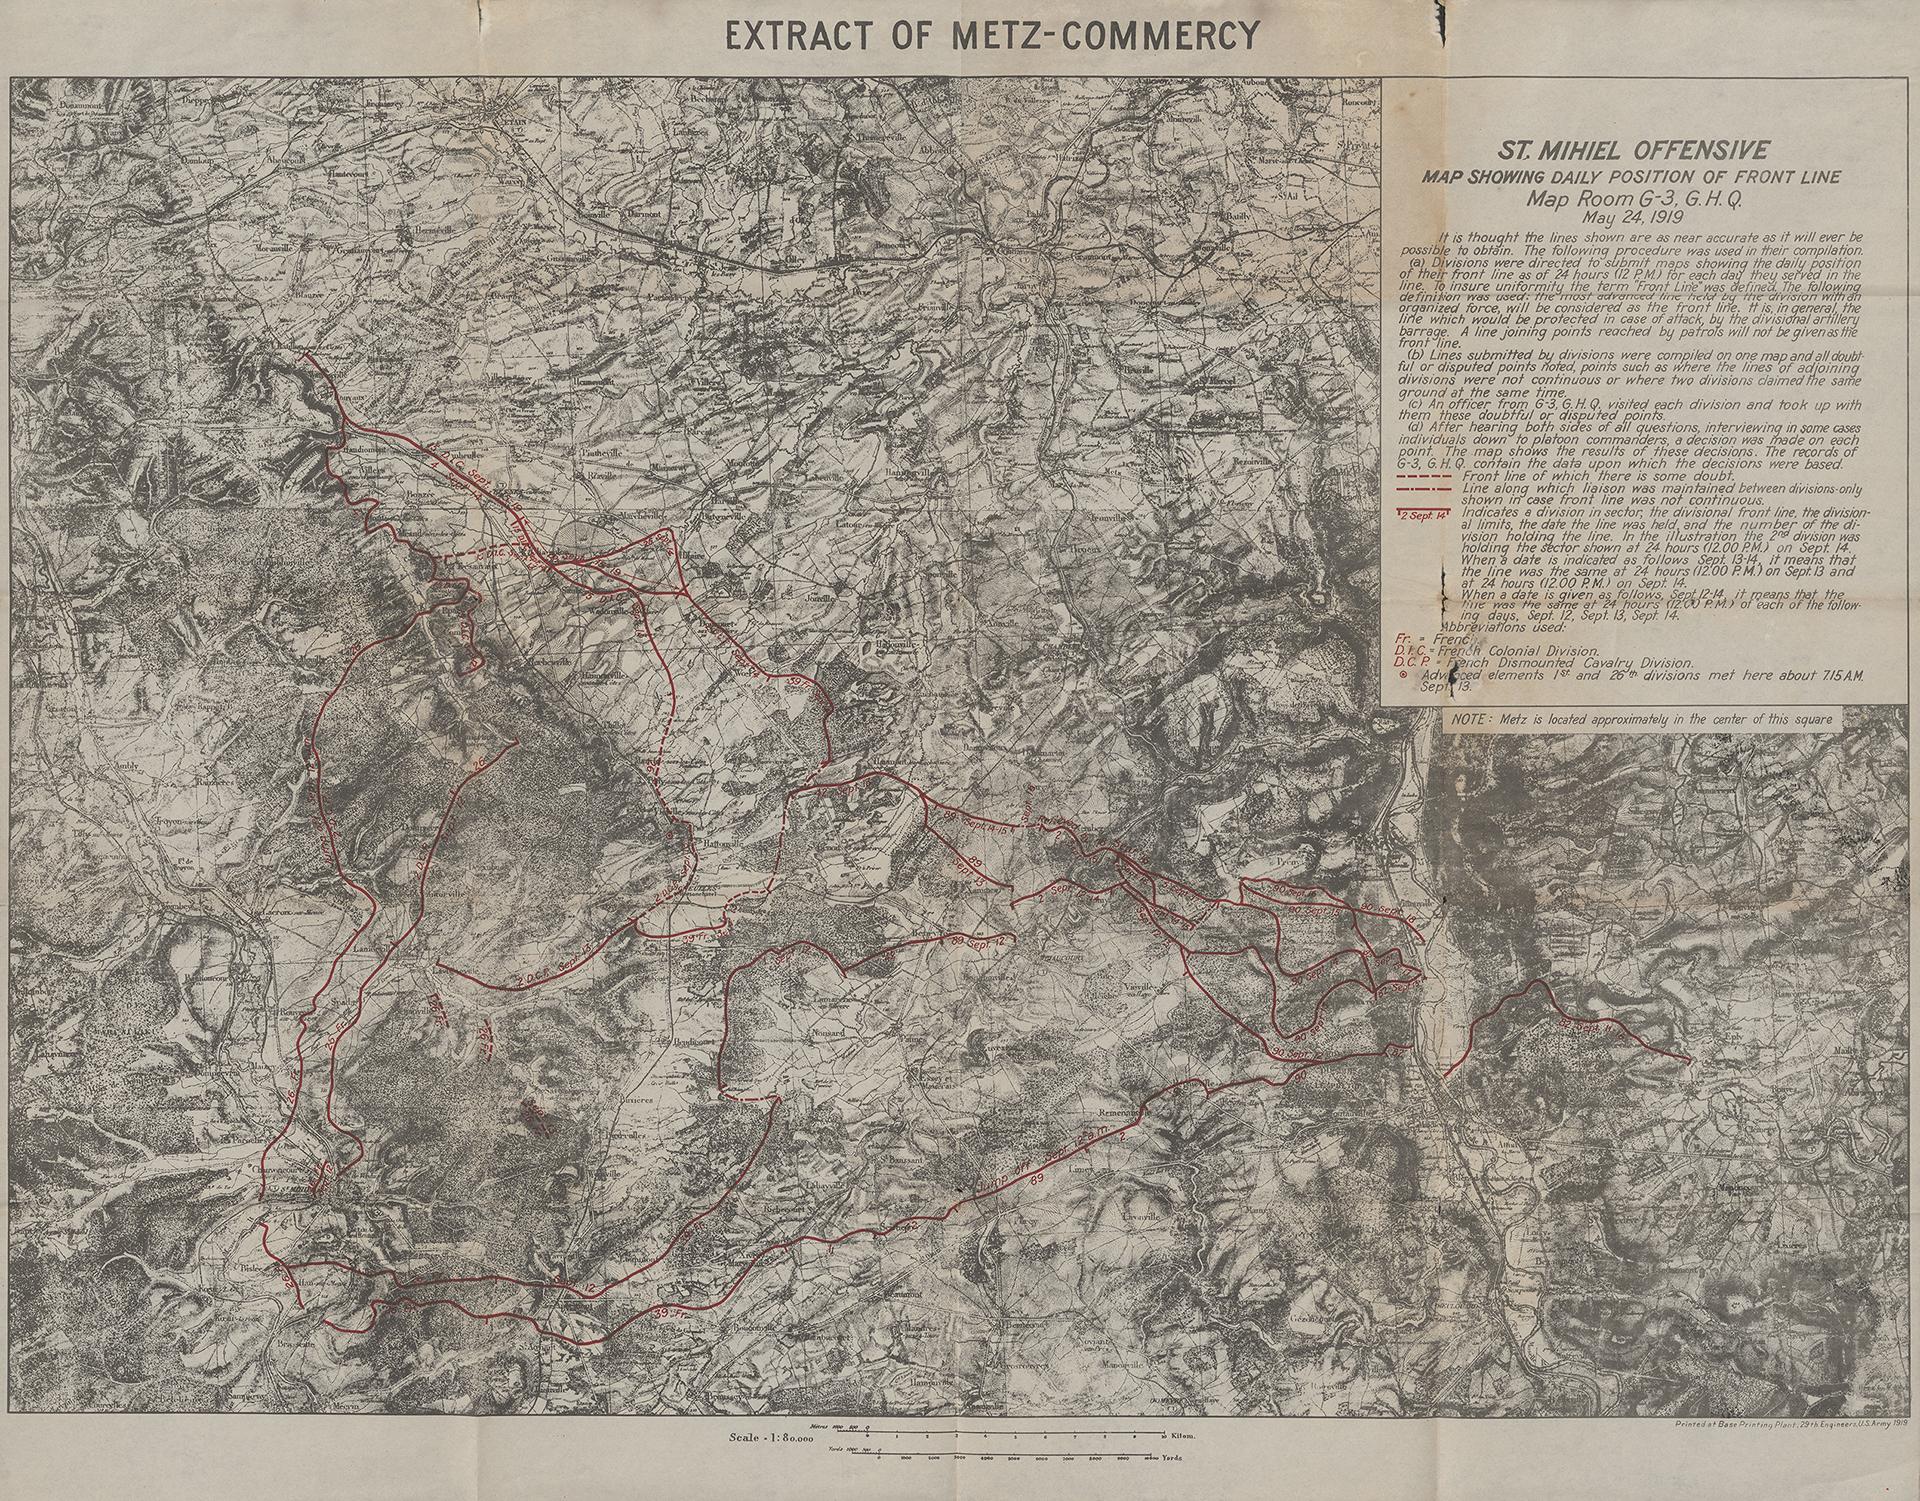
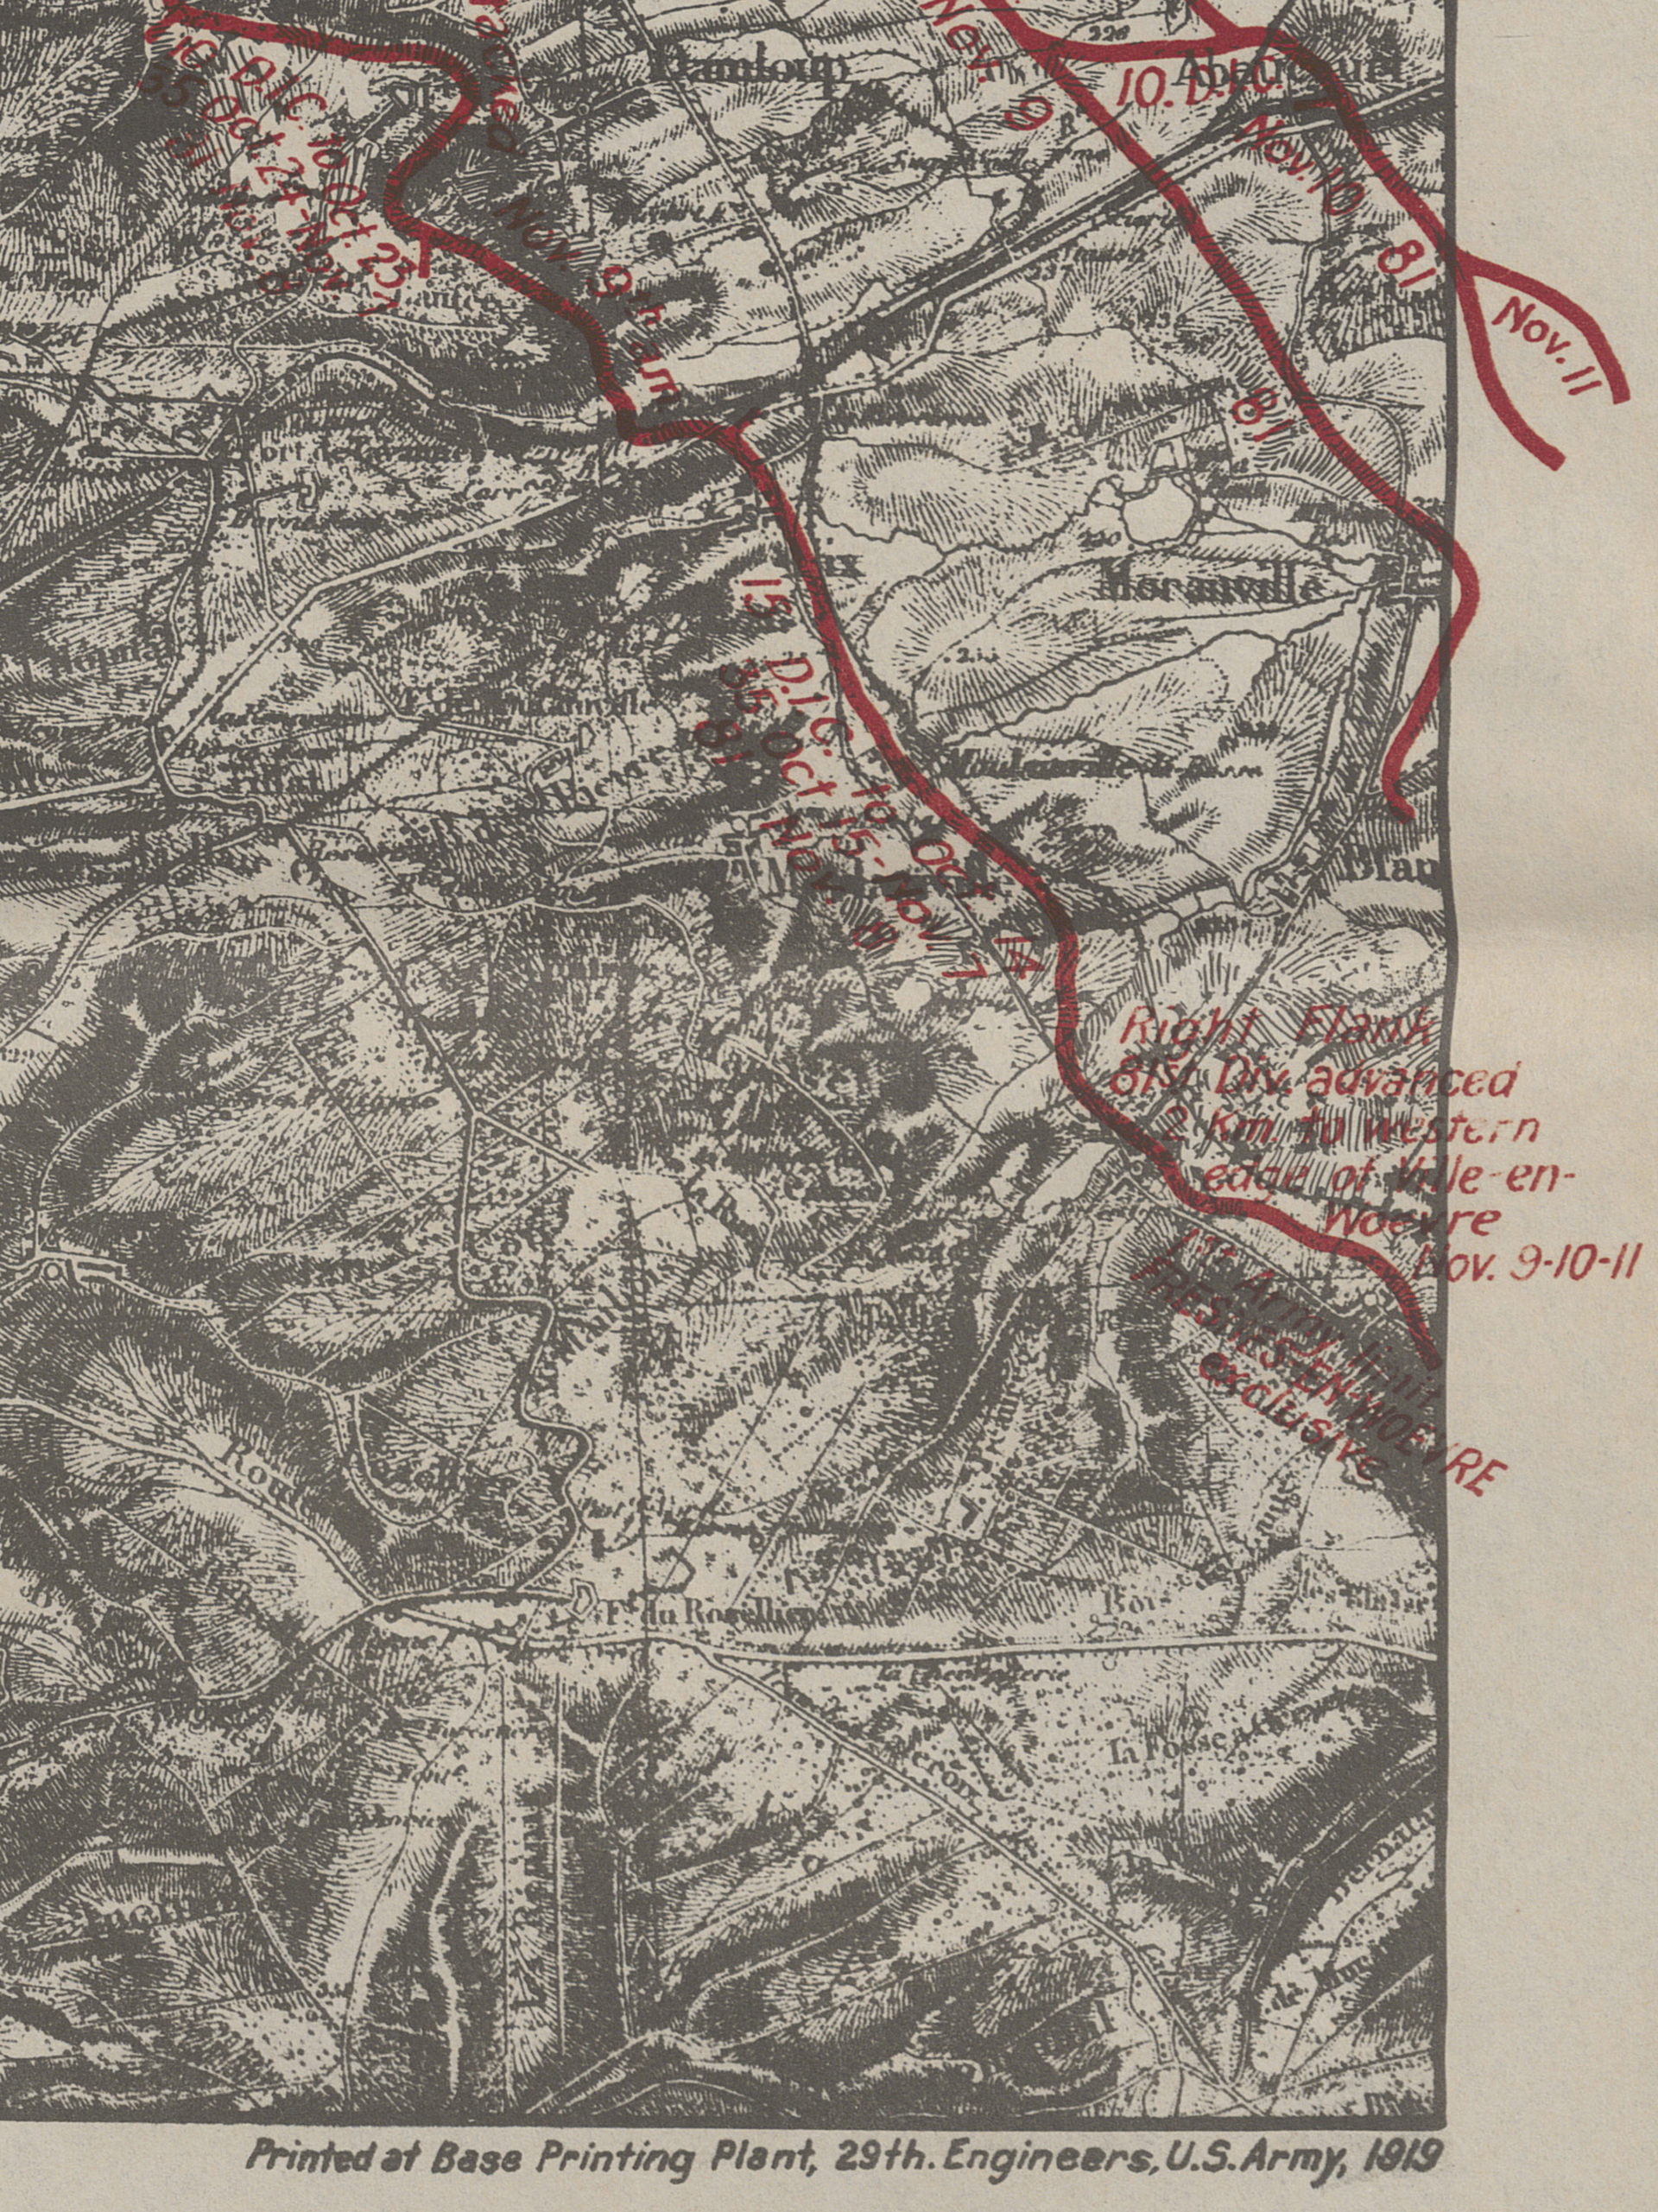
In WWI the strategic overprint was often printed on an existing topographic map, rather than a map created specifically for combat. This “Meuse-Argonne Offensive map showing daily position of front line” is one such map.
The terrain of this area was important to combat and affected the outcome of battles, knowing the topography was vital.
Meuse-Argonne Offensive map showing daily position of front line.(Detail) Many of Col. Fenton’s maps were printing at the U.S. Army, Base Printing Plant in Langres, France, just 125 miles from the front.(Detail) Meuse-Argonne Offensive map showing daily position of front line.
During the month of November we as a nation honor our military veterans. We can’t think of a better way for The University of Texas Libraries to honor their legacy than by telling their stories and making these materials that clearly meant something to them available to researchers for generations to come. Keep an eye on our website for more in depth profiles of these men and the maps they used. Thank you all for your service.
Read, hot & digitized: Librarians and the digital scholarship they love — In this new series, librarians from UTL’s Arts, Humanities and Global Studies Engagement Team briefly present, explore and critique existing examples of digital scholarship. Our hope is that these monthly reviews will inspire critical reflection of and future creative contributions to the growing fields of digital scholarship.
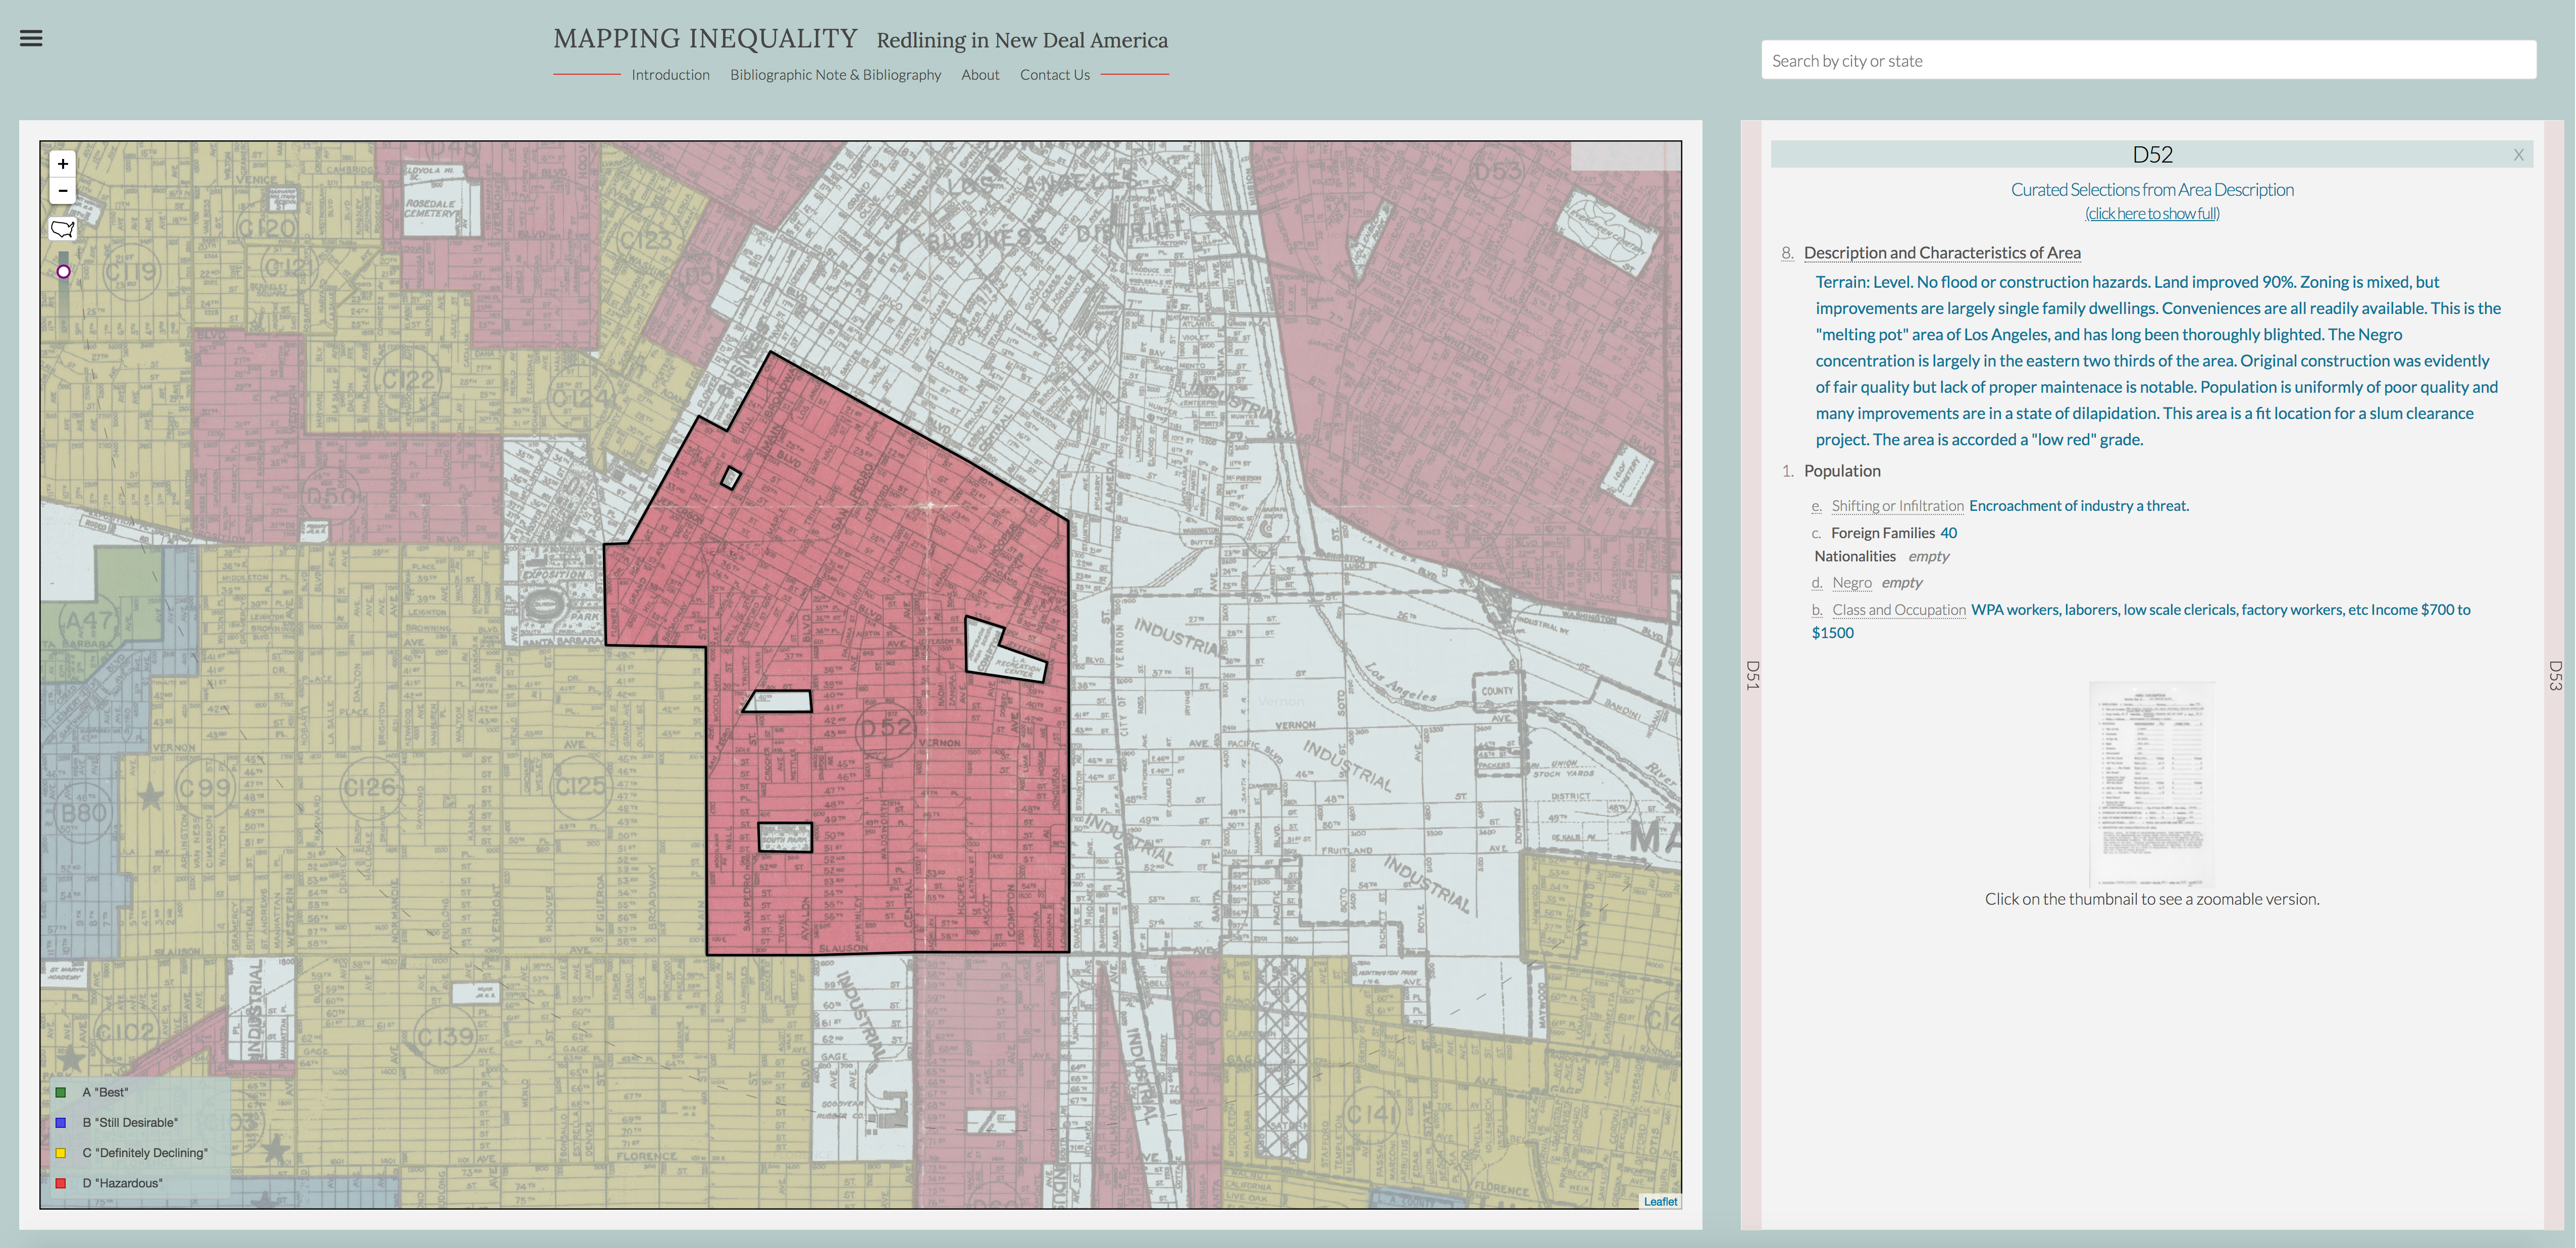
Mapping Inequality: Redlining in New Deal America lets users visualize the maps of the Home Owners’ Loan Corporation (HOLC) on a scale that is unprecedented. The HOLC was created in 1933 to help citizens refinance home mortgages to prevent foreclosures. Directed by the Federal Home Loan Bank Board, the HOLC surveyed 239 cities and produced “residential security maps” that color-coded neighborhoods and metropolitan areas by credit worthiness and risk. These maps and the discriminatory practice they exemplified and enabled later came to be known as redlining.
If you zoom to Los Angeles, CA in Mapping Inequality (I recommend taking a moment to read the short introduction and how to) you will see the historic redline maps overlaid on a web-based map, a color-coded legend that describes areas from Best to Hazardous, and an information panel where you can immediately explore an overview and download raw data. Zoom in further, click a red section of the map, and the “area description” will load in the information panel. The initial view is curated and gives you an immediate impression of how these maps and accompanying documents perpetuated and institutionalized discrimination. You can also view the full demographic data and a scan of the original paperwork.
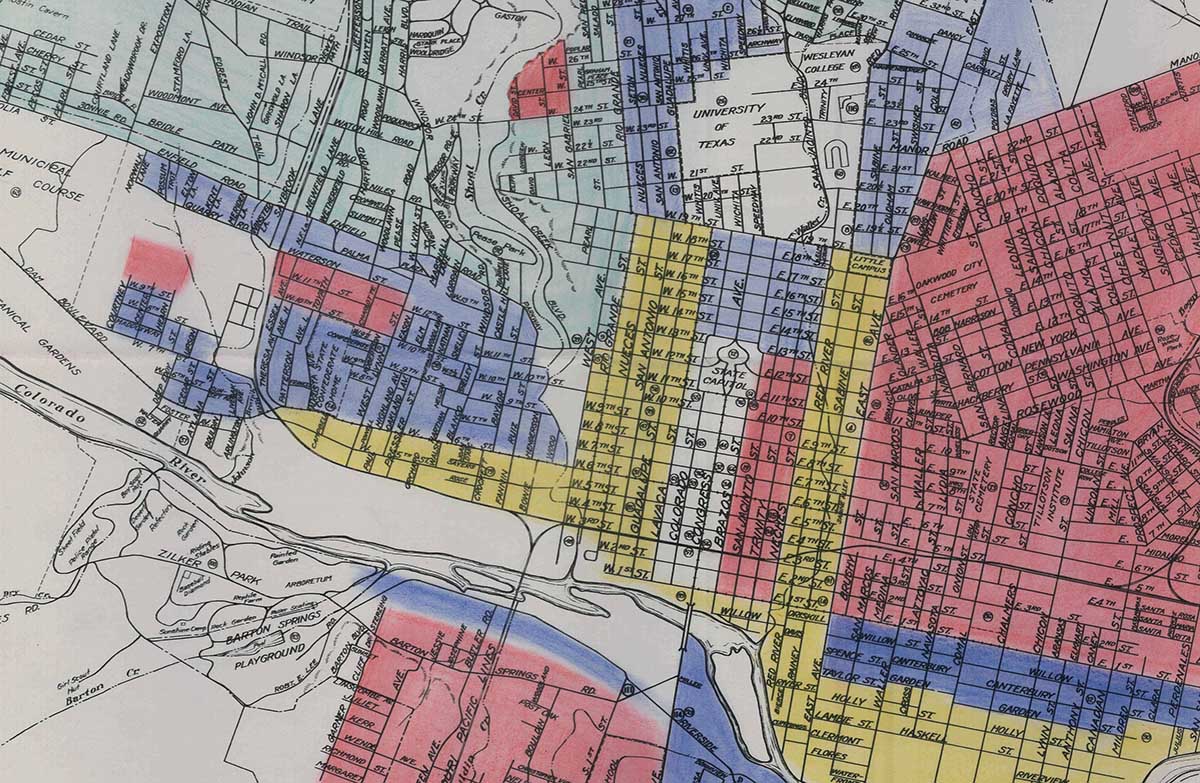
I encourage you to look at cities you are familiar with, it’s startling how the effects of these maps are apparent today. This is a work in progress so not every city surveyed by the HOLC is represented or complete. Unfortunately, the accompanying documents for Austin are not available, but you can view the entire 1935 Austin map on the PCL Map Collection website. (You can also find a digitized reprint of the notorious Austin city plan from the 1920s at Texas ScholarWorks.)
1935 map of Austin, Texas, with redline demarcations.
I chose to highlight this mapping project because redlining maps are a critical example of the power of maps and this interface was beautifully constructed to illustrate their impact.
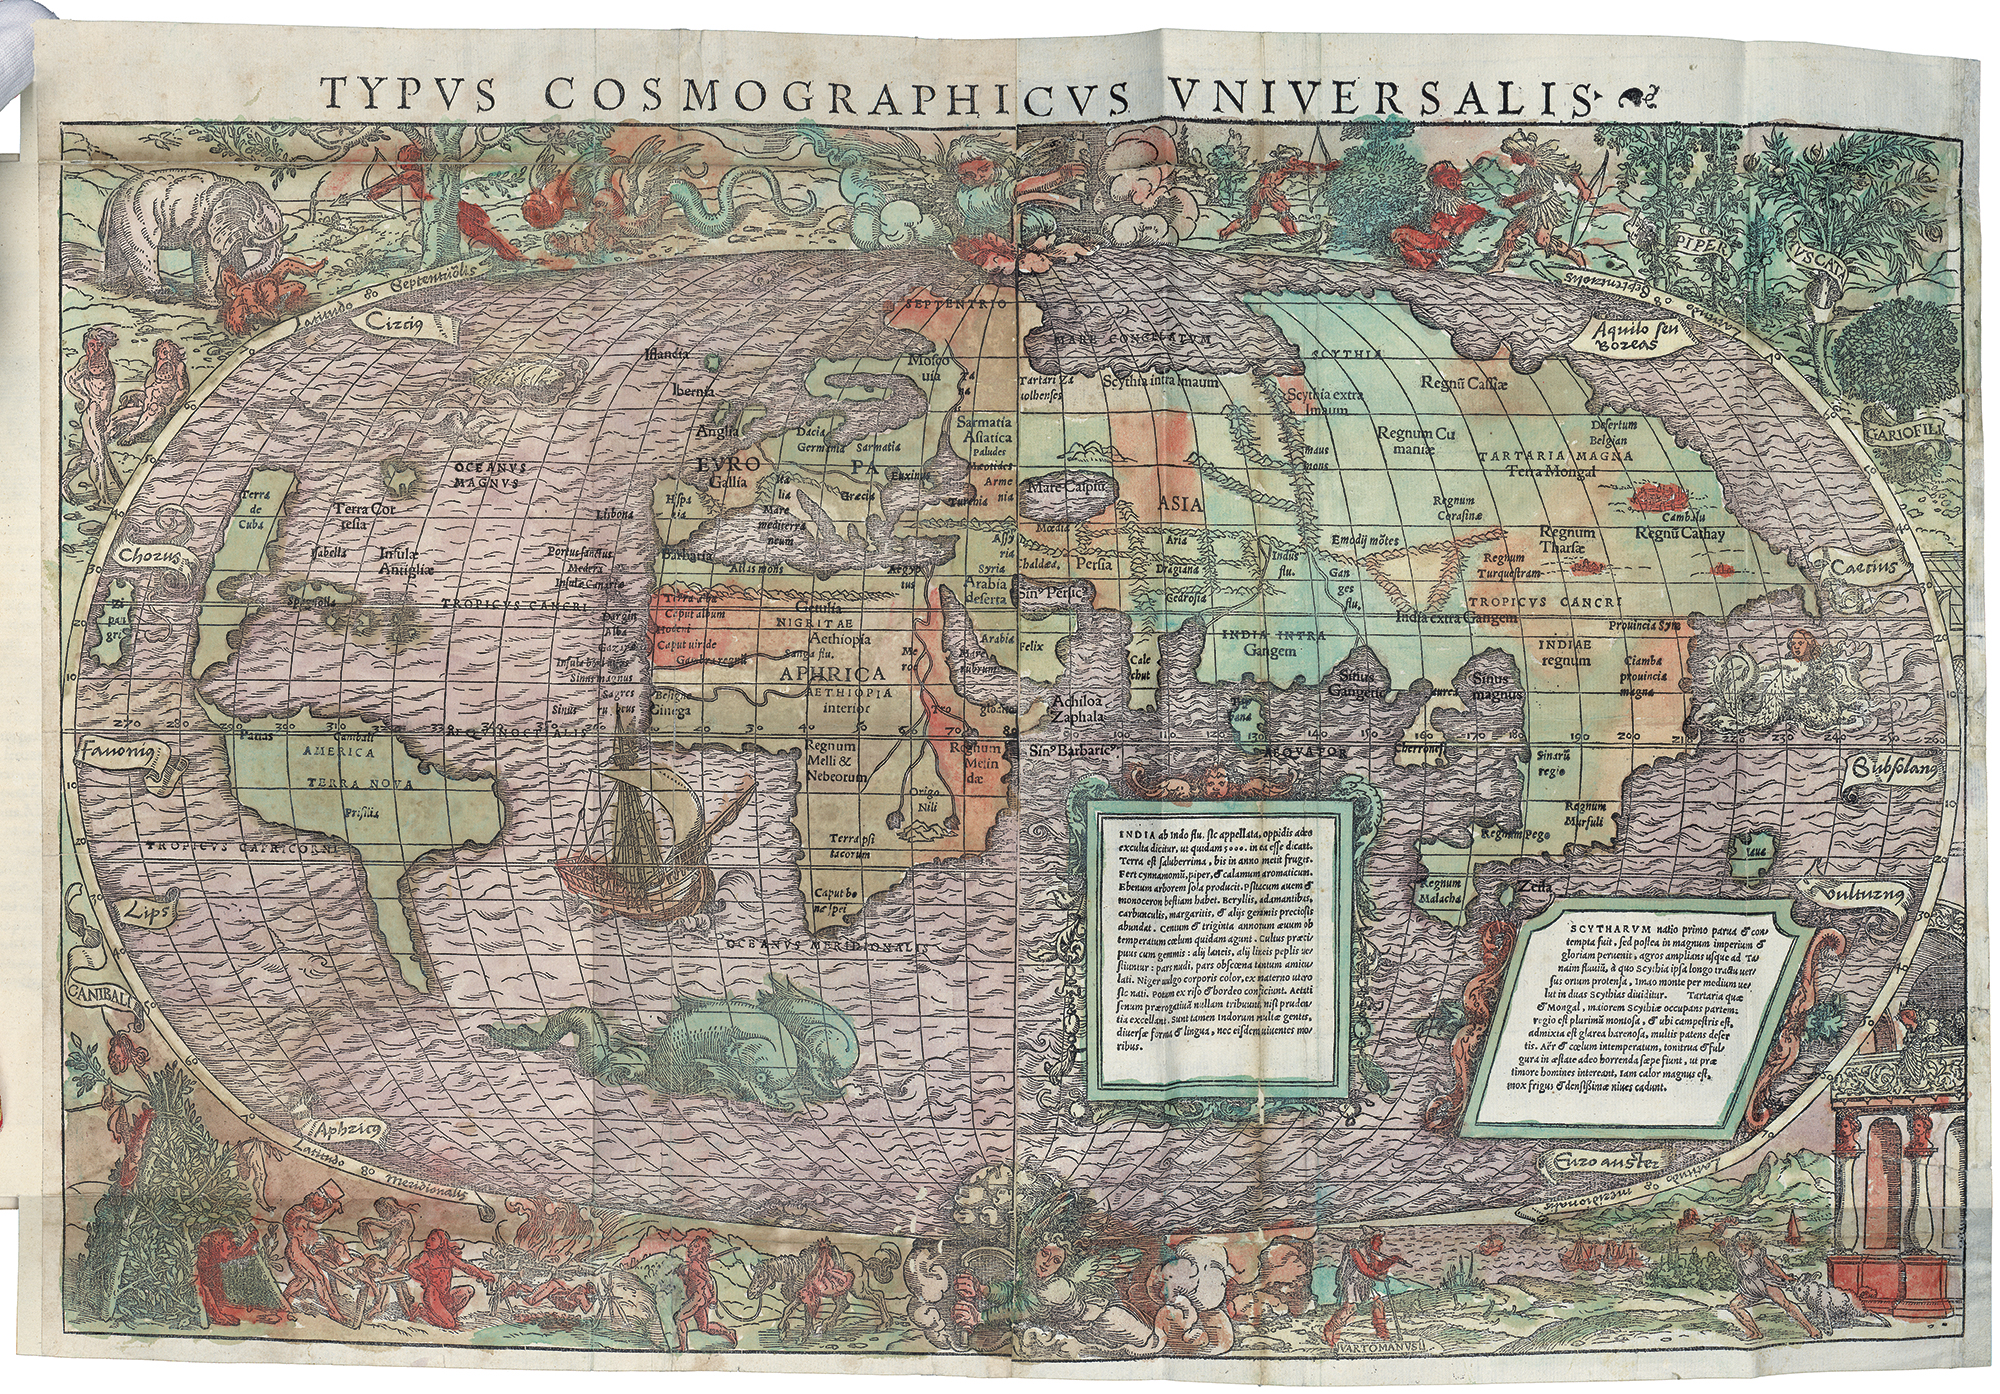
In this important world map, the extent of North America and the distance across the Pacific Ocean are hardly understood while the outline of South America is better represented.
The cartography is attributed to a collaboration between celebrated German mapmaker Sebastian Munster, and a renowned Northern Renaissance artist Hans Holbein, contributed the rich ornamentation at the map’s border.
Holbein’s additional embellishments — including realistic renderings of flora and fauna, as well as fantastic and frightening sea beasts — makes this a superlative example of cartography from the period.
“Typvs Cosmographicvs Vniversalis in Novvs Orbis Regionvm ac insvlarvm veteribvs incognitarvm” Attributed to Sebastian Münster, cartographer, and Hans Holbein the Younger 1537 print and wash on paper 15 x 22 in. Benson Latin American Collection.
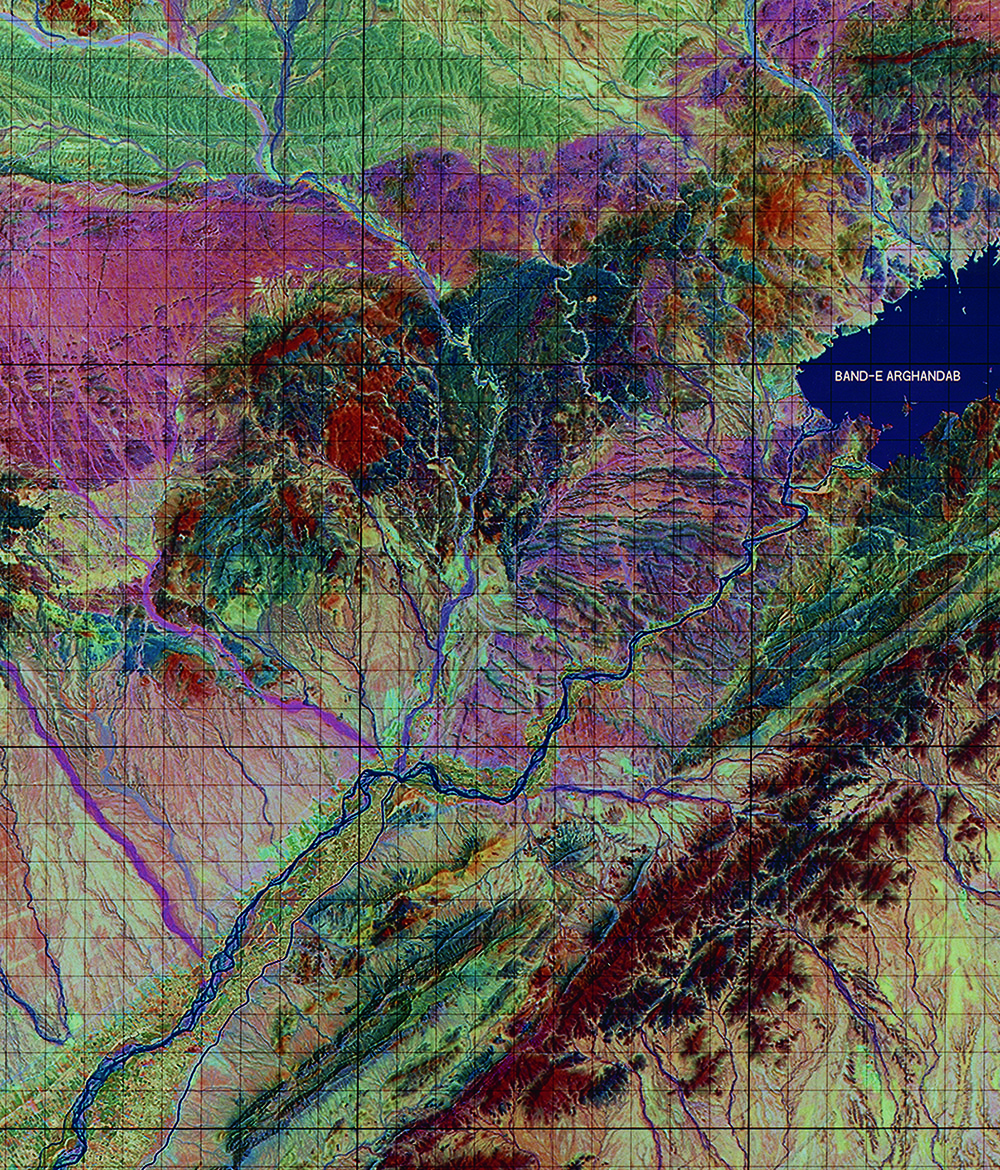
The Tobin International Geological Map Collection provides map materials in support of teaching and research within the Jackson School of Geosciences, its programs and related disciplines. As graphic summaries of earth and planetary data, maps are an integral part of geologic and geographic study as well as an important information source in various aspects of research in such fields as energy, engineering, land use planning, oceanography, physical and space sciences, environmental studies and the life sciences. To serve these disciplines, geologic, tectonic, stratigraphic, physiographic, geodetic, seismographic, outline, topical (such as soil and water survey), geophysical, structural, cross section, and index maps are required.
Located in the Walter Geology Library, the collection contains more than 50,000 maps and map texts that are arranged geographically. It functions as a working research collection that is more concerned with the utility of its maps for research rather than with their rarity as objects.
Tobin Surveys, Inc. of San Antonio endowed the Tobin collection in 1980 when it established the Tobin International Geological Library Fund to enable cartographic acquisitions. The collection aims for worldwide coverage of maps on geology and related subjects, but it is particularly dense in maps of Texas and select U.S. and foreign areas of geologic interest. The resources provide thorough coverage for North America (especially Texas and the Southwest), Mexico, Britain, Italy, Australia, Brazil and Turkey, with moderate coverage for the rest of the world.
The geologic map collection portrays surface and subsurface features, ages, and rock types at a variety of scales. Such maps are used for research in hydrocarbon and mineral exploration, hydrology, geomorphology and paleontology, archeology, and some engineering and architectural applications. The collection also includes some topographic or surface feature maps. Geologic and topographic maps largely are produced by and for governments around the world; however, some commercial maps are included in the collection.
The Tobin collection, in partnership with the Perry-Castañeda collection, serves as a federal depository for the maps of the United States Geological Survey (USGS). Through that arrangement, the collection maintains an almost complete set of the map series published by the USGS, including maps of various scales that provide users the ability to examine a continent, country, or more local geographic regions.
A large collection of geological maps of Greece and Italy, which are of special interest to archaeology and classics researchers, also are held in the collection. Overall, the resources of the Tobin Map Collection serve not only researchers within the geology, architecture, classics, archaeology, engineering, and geography departments, but also the general public.
Alejandro Ruffoni Puerto de Acapulco en el Reino de la Nueva Expaña en el Mar del Sur 1628 lithograph 17 x 22 in. Genaro García Collection Benson Latin American Collection
A facsimile reproduction made in the Florentine workshop of Alejandro Ruffoni of an original early 17th Century drawing of the Port of Acapulco by Dutch engineer Adrian Boot. The reproduction was commissioned by Mexican historian Francisco del Paso y Troncoso.
The panoramic shows the port and fortification at Acapulco, with depictions of the natural flora and geography of the region.
While we’re apt to sound out the world-class general and distinctive materials maintained by the Libraries, these resources are just a single galaxy in a greater universe of extraordinary collections across UT campus.
In the first of its kind accounting, the University of Texas Press has just released a massive assemblage of the rare, unique and exceptional collections that reside on the Forty Acres in the form of The Collections, a necessarily significant tome documenting the various holdings — recognizable and not so — from around UT.
Represented in the book are Libraries mainstays such as the Benson Latin American Collection, the Alexander Architectural Archive, the PCL and Walter Geological Map Collections and the Historical Music Recordings Collection, as well as highlights from discrete collections across the branches.
The book features hundreds of items from more than 80 collections campus-wide, covering a range of subject areas: archaeology, ethnography, fine and performing arts, rare books and manuscripts, decorative arts, photography, film, music, popular and material culture, regional and political history, natural history, science and technology.
Edited by Andrée Bober with the support of more than 350 staff from across the university, The Collections features a foreword by UT Austin President Gregory L. Fenves and a historical introduction by Lewis Gould, professor emeritus of American history, whose essay traces the formation of the collections and acknowledges many people whose visions are manifest in these material resources.
It’s certainly the case that our perception of the world’s geography is rooted in our experience with the maps we’ve encountered, developed and designed over eons by both hand and machine. Even though we may have become increasingly reliant on disembodied voices to lead us where we need to go, the archetype for understanding the concept of location which we carry in our minds was instilled by the road guides of family vacations, massive retractable world maps of the elementary classroom and spinning globes of our past.
Equal parts art and science, maps are one of the most effective methods for conveying information visually in virtually any field of inquiry. In the miniaturization of space that is necessary to explain vast areas on a personal scale is a documentation of history and of change; of character and personality, value and values; of plant and animal; of health and illness, feast and famine; of motion and stasis; and of nearly any aspect of life and place that can be categorized for better understanding the world in which we live.
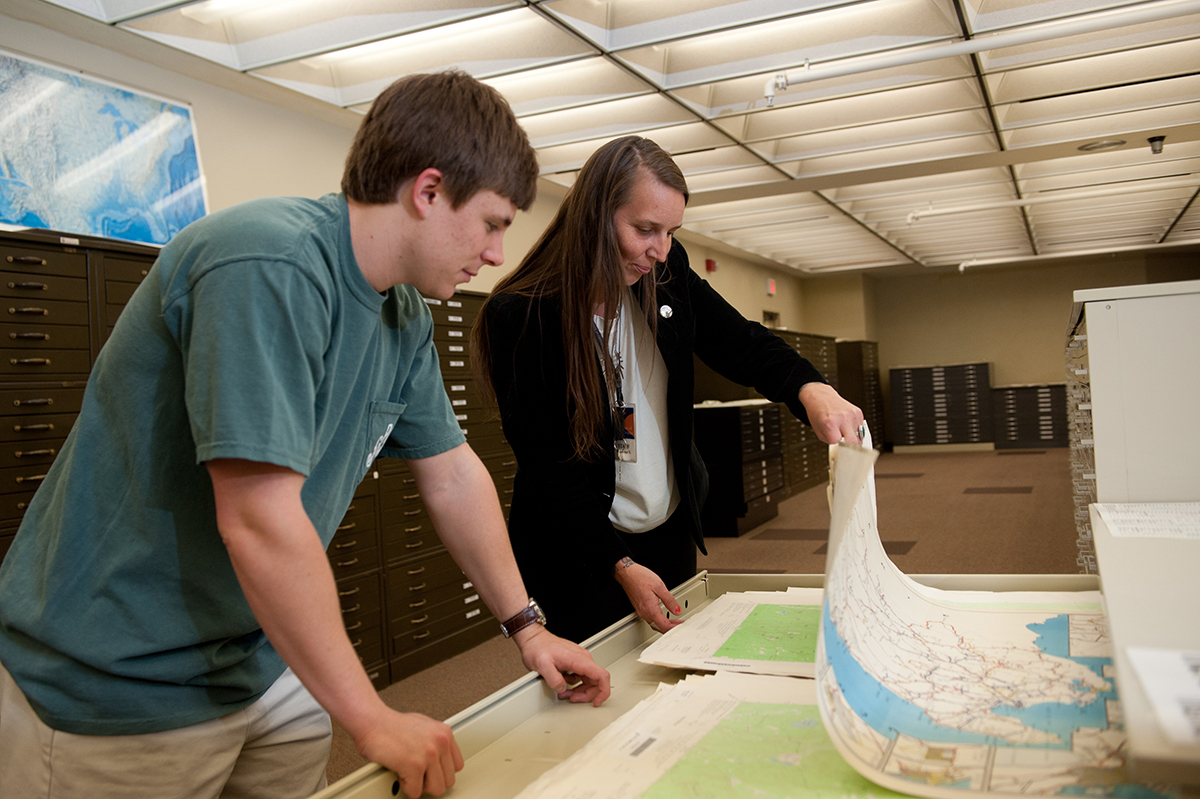
PCL Map Collection manager Katherine Strickland assists a patron.
And that, perhaps, is what makes the map collection at the Perry-Castañeda Library so incredibly valuable. Its scope in both size and subject is immense enough to maintain an intrinsic value — both as historical artifact and as a tool of modern research and reference — that goes unaffected by the passage of time.
Though the Perry-Castañeda Library Map Collection is considered a general collection, it’s anything but. Residing on the first floor of the university’s flagship library, it features more than 250,000 cartographic items representing all areas of the world. And its online component is not only one of the most highly visited websites at the university — garnering nearly 8 million visits annually — but is in the top ten most popular results for a Google search of “maps.”
The university began informally collecting maps previously — at the General Libraries, but also through efforts at the Geology Library, the Barker Texas History Center and the Benson Latin American Collection — but it wasn’t until the PCL opened in 1977 that the Map Collection was established on the first floor of the building as an independent collection.
The core of the collection emerged with the acquisition of the U.S. Geological Survey topographic maps, which date from the late 19th century and cover the entire United States, U.S. territories and other parts of the world where governments contracted U.S.G.S. for mapping, such as Saudi Arabia.
The collection also houses an extensive collection of atlases, from a street atlas of El Paso to the National Atlas of India. The library also purchases commercial and foreign government-issued topographic map series, country, city and thematic maps. The collection also includes a small but popular collection of plastic raised-relief maps and globes, not only of earth, but of the Moon, planets and other various celestial bodies.
Most of the maps in the collection date from 1900 to the present, and the collection is constantly being updated with newer materials, and complements a number of significant historical map collections housed on campus in the Center for American History (historical maps of Texas), the Benson Latin American Collection, the Harry Ransom Center and the Walter Geology Library.
Paul Rascoe — the Libraries’ Documents, Maps, & Electronic Info Services Librarian — has been the driving force behind the collection at PCL, especially in the formulation and execution of the collection’s online component. And it hasn’t hurt to have the planets align, at times.
“In 1994, we decided that we were going to scan maps,” says Rascoe. “We had a Macintosh computer and a Mac scanner, which I believe cost $100. We had a plan to put them in sort of a web menuing system called Gopher, but fortunately, simultaneously with our wanting to put maps online, the first web browser was introduced in that year.” Continue reading You Are Everywhere – The PCL Map Collection→
Not overlooked in the article, our own PCL Map Collection gets a mention:
Having such a large collection of cartographic history in one place and accessible by anyone with a browser is extraordinary enough. But it’s not the only online map collection of note. The University of Texas’s Perry-Castañeda Library Map Collection has been a familiar online companion from the early days.
It’s hard to believe it has already been five years since Hurricane Katrina nearly leveled the Big Easy.
Next Tuesday (8/31), the Libraries will host a novel event to mark the occasion of the fifth anniversary and reflect on the costliest natural disaster in American history.
The interactive program and exhibit – Hurricane Katrina: 5 Years Later – will take place in the Map Collection on the first floor of the PCL, and will feature relevant Libraries resources like maps, books and video along with presentations by both faculty and experts familiar with the past and current state of the affected areas.
The event is free and open to the public, and takes place from 11:30am-1:30pm, so please drop by, have some New Orleans-style café au lait and join in the discussion.


