Category Archives: Features

Read, Hot and Digitized: Mapping Emotions in Victorian London

Read, hot & digitized: Librarians and the digital scholarship they love — In this series, librarians from UTL’s Arts, Humanities and Global Studies Engagement Team briefly present, explore and critique existing examples of digital scholarship.  Our hope is that these monthly reviews will inspire critical reflection of and future creative contributions to the growing fields of digital scholarship.

As readers, we often subconsciously craft physical spaces – whether real or imagined – in our minds in an effort to find meaning within or forge a connection with the text. The same can be said of the real-world cities in which different works of fiction take place. London, replete with a rich history of representation throughout the arts, is a standout example of one such city that writers return to time and again to inspire adaptations, reimaginings and original content. One need look no further than recent shows like Sherlock or Penny Dreadful to evince this. Keeping with this interest, researchers have created a tool that allows people to quickly and easily look back at those original texts that helped shape popular conception of London in the form of an interactive map of specific sites.

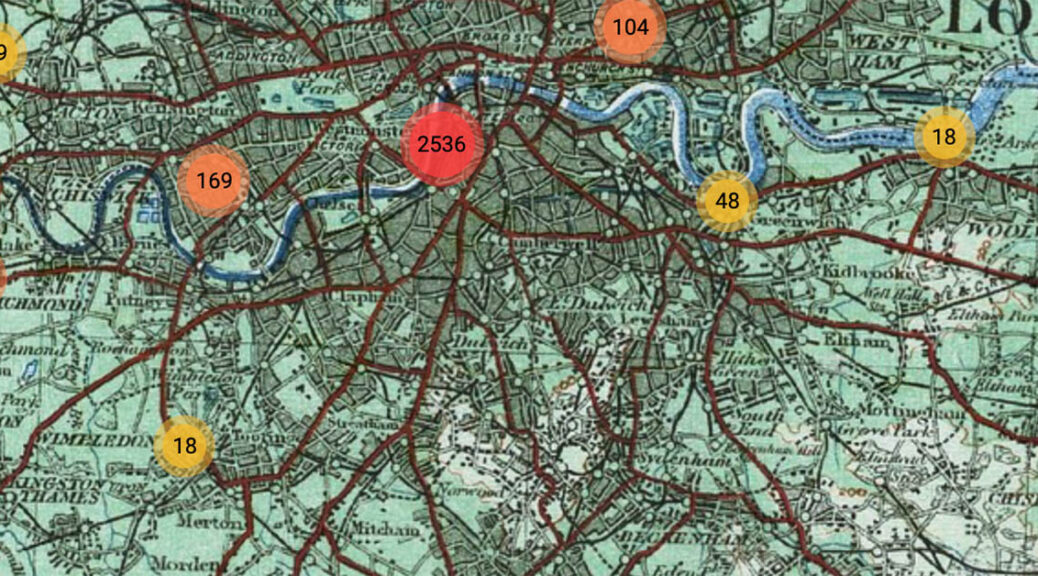
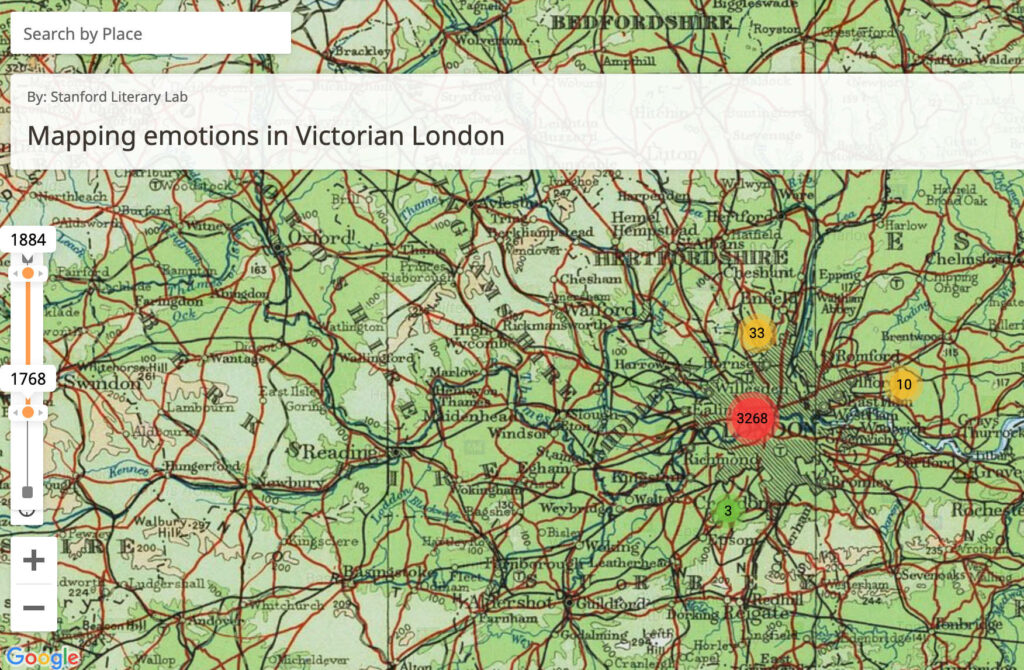
Mapping Emotions in Victorian London is a digital project created at Stanford University that uses literary excerpts from 18th and 19th century novels to map the emotions associated with different public spaces throughout London. The interactive map, hosted on History Pin, allows users to geospatially visualize data from those passages and read the excerpted passages in one streamlined interface. The map itself was created using Google Maps but features multiple levels of overlaid antique, illustrated maps, which shift depending on the scale selected, lending a visually pleasing touch to the tool without sacrificing utility or data integrity. Using it is as simple as selecting a date range and then clicking through numbered hubs on the map until you arrive at a particular site and the corresponding text.

Click on the color coded local “hubs” to zoom in and view specific sites on the map.
Once a user has selected a particular pin (indicated in pink, above left), the corresponding text selection will appear alongside the map.

Originally conceived as a small-scale project using topic modelling to extract geographical information from nineteenth century novels, “Mapping London” later expanded to encompass a collaborative effort between the Stanford Literary Lab, the Center for Spatial and Textual Analysis (CESTA), and the Mellon Foundation. Building upon the success of their preliminary efforts (documented in a 2016 pamphlet), the site developers received a grant tied to crowdsourcing that pushed the project to new depths. Anonymous volunteers used Amazon’s Mechanical Turk marketplace to crowdsource the project by assigning emotions to the thousands of excerpted passages. The crowdsourcing aspect of the project is what took it to another level by allowing researchers to expand both the quantitative and qualitative methods used. Not only were they able to process vastly more information and include more sites and passages in the data set, but humans (rather than bots or AI) were able to accurately ascribe emotions to the text.

While the ultimate goal of the project was to expand possibilities for both close and distant reading research in the humanities, what stood out to me was how accessible and interesting the map would be to everyday readers including those outside of academia. For people new to or unfamiliar with digital projects, this is a very accessible and easy to understand collection. Furthermore, anyone pursuing a personal interest in specific sites in London, a particular author represented in the data set, or just intrigued by the concept of literary geography would have something to gain by exploring the map. It functions as a historical city tour through the eyes of different narrators, and might even introduce you to your new favorite author.

_____________________________________________________________________________

Explore further with UT Libraries!

Learn more about the concept of topic models in Ch. 9 of Foundations of Data Science.

Blum, Avrim, John E. Hopcroft, and Ravindran Kannan. Foundations of Data Science. Cambridge: Cambridge University Press, 2020.

https://search.lib.utexas.edu/permalink/01UTAU_INST/be14ds/alma991058049444506011

Trace the connections between social production and London-focused literature and discover how the Bloomsbury district of London developed in relation to the city’s literary output.

Ingleby, Matthew. Nineteenth-Century Fiction and the Production of Bloomsbury : Novel Grounds. London, United Kingdom: Palgrave Macmillan, 2018.

https://search.lib.utexas.edu/permalink/01UTAU_INST/apl7st/cdi_askewsholts_vlebooks_9781137546005

Take an in-depth dive into the world of literary spatial studies with Lisbeth Larsson’s investigation of London through the lens of Virginia Woolf’s oeuvre.

Larsson, Lisbeth. Walking Virginia Woolf’s London: An Investigation in Literary Geography. Cham: Springer International Publishing AG, 2017.

https://search.lib.utexas.edu/permalink/01UTAU_INST/apl7st/cdi_swepub_primary_oai_gup_ub_gu_se_260720

Experience historic London firsthand through descriptions compiled in this fully digitized guide book from 1902, courtesy of UTL’s “Travel at the Turn of the 20th Century” digital collection.

Karl Baedeker (Firm). London and its environs. 1902. “London and its environs – Collections”. University of Texas Libraries Collections.

https://collections.lib.utexas.edu/catalog/utlmisc:40a94727-537b-46b1-b688-fe6b440bd2d8

If old books are more your cup of tea, check out the Harry Ransom Center’s extensive eighteenth- and nineteenth-century collections with works from many London-based authors, including Charles Dickens, Wilkie Collins, Lewis Carroll, and many more.

Read, Hot and Digitized: The Texas Archive of the Moving Image

Read, hot & digitized: Librarians and the digital scholarship they love — In this series, librarians from UTL’s Arts, Humanities and Global Studies Engagement Team briefly present, explore and critique existing examples of digital scholarship.  Our hope is that these monthly reviews will inspire critical reflection of and future creative contributions to the growing fields of digital scholarship.

Preserving audio visual materials is one of the biggest challenges for archivists and preservationists. The Texas Archive of the Moving Image (TAMI) has approached the preservation of Texas’ film history in innovative and unprecedented ways for the last 20 years. The non-profit organization solicits any kind of film – home movies, advertisements, local television programs, corporate productions, amateur films and even professional movie productions, and offers to digitize them in exchange for a donation of the digital copy. As a result, TAMI has a digital archive of over 50,000 films by Texans or about Texas. Created by Caroline Frick, currently the Associate Chair of Media Studies in the Radio, Television and Film department at UT Austin, TAMI’s stated goals are to “discover, preserve, provide access to, and educate the community about Texas’ film heritage.” Not only are they preserved for long-term historical and research purposes, but a huge number of those films are accessible online through TAMI’s website.

The casual user can enjoy this site by simply watching videos highlighted on their homepage. They feature a rotating selection of interesting films, with a ‘watch next’ feature and a ‘random video’ selector. I will admit to having fun reminiscing about places I’ve visited and lived in Texas, as well as getting sucked into the fascinating, the weird, and the sometimes inexplicable videos on the site (take, for instance, this baffling 1978 corporate wine industry video from Dallas).

More importantly, TAMI takes their educational mission seriously, with multiple sections that place films within their geographical, historical and social contexts. An education page provides lesson plans on topics from a Texas perspective such as The Cold War, The Dust Bowl and the Galveston Hurricane of 1900. Each lesson plan includes a curated selection of films accompanied by class conversation prompts, assignment ideas and how the themes fit within Texas’ TEKS and STAAR standardized testing requirements. 

The Education and Web Exhibits pages bring together digital technologies in creative ways to teach new understandings of Texas history. The Webs Exhibits section looks at different aspects of Texas. For instance, ‘La Frontera Fluida – The Fluid Border’ explores films of the Texas-Mexico borderlands. On the site you can view films depicting historical events from a historical chronology page, a subject page, and even geographically from a map of the border. These value-added aspects are great examples of a digital-humanities approach, but TAMI also makes these films available for researchers to use in their own projects. Each film has code that allows you to embed the film on your own page. This makes the content of the archive ripe for myriad digital humanities projects exploring every aspect of Texas.

The University of Texas Libraries owns or subscribes to an enormous collection of audio-visual materials originating from every corner of the globe. A simple search in the library catalog for video/film turns up over 75,000 results. While the majority of this material is not necessarily focused on Texas, the library  does have incredible collections of audio-visual materials that originate in the state.

At the Benson Latin American Collection, for instance, we have significant collections of film focused on the history and culture of Latinas/os in Texas, especially focusing on Mexican Americans and the Chicano movement. This includes large numbers of interviews with prominent activists,  documentaries and archival collections such as the Cine las Americas video collection and a collection of their festival materials, the Robert P. and Sugar C. Rodriguez collection of Tejano Music videos, and the Los del Valle project. All of these materials can be crucial primary and secondary source materials for research projects. Taken together with the materials found in TAMI, I can almost always find something useful for students doing research on Texas Latinas/os when they are looking for audio visual materials. No other state has a statewide digital film archive like TAMI, and we are privileged to have such as amazing resource at our fingertips.

All images from the Texas Archive of the Moving Image website and Instagram site.

Further resources:

Frick, Caroline. “An Interview With Caroline Frick of the Texas Archive of the Moving Image and the University of Texas at Austin Department of Radio-Television-Film” The Velvet light trap: 2013, Vol. 71 (1), p. 42-6.

National Film Preservation Foundation https://www.filmpreservation.org/.

Library of Congress Moving Image Research Center. Digital Moving Image Collections. https://www.loc.gov/rr/mopic/ndlmps.html

Read, Hot and Digitized: Documenting Judeo-Spanish

Read, hot & digitized: Librarians and the digital scholarship they love — In this series, librarians from UTL’s Arts, Humanities and Global Studies Engagement Team briefly present, explore and critique existing examples of digital scholarship.  Our hope is that these monthly reviews will inspire critical reflection of and future creative contributions to the growing fields of digital scholarship.

Documenting Judeo-Spanish was launched in Spring 2020 under the leadership of Dr. Bryan Kirschen, a sociolinguist specializing in Hispanic languages at the Romance languages department at Binghamton University, NY (Twitter @LadinoLinguist).

“Ladino (also known as Judeo-Spanish or Judezmo) refers to the variety of Spanish that developed among Jewish populations who were expelled from Spain in 1492 and subsequently settled throughout Turkey and the Balkans, then of the Ottoman Empire. These Jews, known as Sephardim, preserved many features of Medieval Spanish, while incorporating linguistic elements from the languages spoken in their surroundings. As a Jewish language, Ladino has always been in contact with Hebrew. And while it may sound like other Romance languages, in writing, it would have traditionally appeared more similar to a Semitic language. This project deals with documents in Judeo-Spanish written in Solitreo. Solitreo refers to the Hebrew-based cursive script once used by Sephardim; it is the cursive variety of the Rashi (Rabbinic) script; it derived from Galician/Portuguese, meaning ‘to spell.’[1] This style of writing is distinct from the Ashkenazi-based alphabet used for cursive Hebrew today, making documents in Solitreo undecipherable to the untrained eye. Solitreo is now a nearly-extinct alphabet to an endangered language, as most writers of the language utilize Roman characters.”[2]

The Documenting Judeo-Spanish project contains a range of documents from journal entries and ledgers, to personal correspondence, prayers, poetry, and community minutes. The project currently presents 25 selected documents (out of 150 already collected from around the world). Beyond these fascinating digitized texts, the most compelling tool is one that allows users to engage with the paleographic endeavor of deciphering the script. Hovering one’s mouse over a word in Solitreo will reveal its Latin-character equivalent form in Judeo-Spanish, while clicking on that word would show a tooltip with the literal translation of the lexical term. Below each digitized object there is also downloadable PDF file, containing the parallel text in Romanization of Judeo-Spanish as well as English translation. Metadata about both the content of the item and its digital file is included as well. Some items include a short recording of the text (in WAV format) being read in Judeo-Spanish. See for example this postcard: https://documentingjudeospanish.com/explore/postcards/djs0075/

Additional tools are expected to be launched soon, including a fully-developed font in Solitreo which would include individual and final forms of letters, ligatures, numbers, punctuation, and diacritical marks.[3]

Kirschen’s project could be used both within and outside of academia. Its audience are educators, students, scholars, and the public. While it could be used as a pedagogical tool, introducing students to an extinct script, it could also be used by the community, allowing users to learn how to read personal items and re-connect to their heritage. What I really like about this project is that all 150 items that were processed for it were gathered from the public. As opposed to other projects that use existing collections, Documenting Judeo-Spanish is serving like an ‘aid force,’ connecting the academia with the community. 

Related resources (with annotations):

Aki Yerushalayim : revista de las emisiones de Israel en djudeo-espaniol. Jerusalem: s.n., 1979.

The UT Libraries hold a full run of this Ladino language journal, published in print 1979 to 2016 and resumed publication in digital in 2019. Many of its issues include a section dedicated to Solitreo and its transcription. See UTL catalog. Some issues are also available online.

Barocas, David N. A Study on the Meaning of Ladino, Judezmo, and the Spanish Jewish Dialect / by David N. Barocas ; with an Introductory Essay by Henry V. Besso on Judaeo-Spanish, Its Growth and Decline. New York: Foundation for the Advancement of Sephardic Studies and Culture, 1976. (see UTL catalog).

Bunis, D. A guide to reading and writing Judezmo. Brooklyn, N.Y.: The Judezmo Society, 1975. Downloadable from the author’s academia.edu page.

Bunis, D. Soletreo: Writing the Ladino Script with Prof. David Bunis. Stroum Center for Jewish Studies. University of Washington, 2015. In this video, Professor Bunis reviews and illustrates how to write each letter of Ladino in both the Rashi and Solitreo alphabets.


[1] For many Sephardim, Solitreo was simply known as ganchos, meaning ‘hooks,’ due to the ligatures that form between letters (https://documentingjudeospanish.com/solitreo/)

[2] Kirschen, Bryan. “Our Project.” Documenting Judeo-Spanish, 2020, www.documentingjudeospanish.com/project.

[3] https://documentingjudeospanish.com/tools/

Participatory Community Archiving: The South Asian American Digital Archive

Read, hot & digitized: Librarians and the digital scholarship they love — In this new series, librarians from UTL’s Arts, Humanities and Global Studies Engagement Team briefly present, explore and critique existing examples of digital scholarship.  Our hope is that these monthly reviews will inspire critical reflection of and future creative contributions to the growing fields of digital scholarship.

May marks Asian American and Pacific Islander (AAPI) Month and reminds us to celebrate the contributions of AAPI communities in the U.S. and to confront the ongoing trials experienced by members of the AAPI population.  AAPI Month also challenges us to learn more about the diversity of peoples and cultures enfolded under such a broad umbrella.  This post suggests that we unpack the complexity such a ubiquitous but ultimately masking label as “Asian American” by looking closely at just one community, South Asian Americans, through the lens of a digital project, the South Asian American Digital Archive (SAADA).

The core of SAADA is community building through documentation and action.  Documentation takes the form of an online repository of narratives, including the personal and private (oral histories, written correspondence, photographs) and the published (newspaper clippings, academic articles).  That archival core forms the foundational structure around and through which SAADA organizes and facilitates action (the process of documentation, educational events, community building).  Throughout, the intention is to represent the complexity of South Asian American experience in an effort to create a more inclusive society.  As their vision states, “We envision American and world histories that fully acknowledge the importance of immigrants and ethnic communities in the past, strengthen such communities in the present, and inspire discussion about their role in the future.”[1] 

Browsing the archive allows one to learn more about topics such as the histories of South Asian immigration or the intersectional engagement of the community, but also demands that one consider the continuity of those histories in the present.

SAADA exemplifies the power of the “community archive.”  Purposefully participatory rather than merely consumptive in practice, community archives encourage those described, presented and preserved in an archive to determine not only what is included and excluded but also how.  As such, SAADA offers an insider-driven alternative to colonial and colonialist libraries and archives, an alternative realized through action.  They are not alone in their efforts.  Other powerful examples of anti-colonial community archival practice include  platforms such as Mukurtu, an open source content management platform that empowers and operationalizes knowledge systems inherent to a community (as opposed to those from outside), and UT-affiliated initiatives such as the Human Rights Documentation Initiative which supports the Texas After Violence Project and the Genocide Archive of Rwanda

Learn more!

Caswell, Michelle, “Seeing yourself in history: community archives and the fight against symbolic annihilation,” The Public Historian 36: 4 (November 2014), pp 26-37. https://doi.org/10.1525/tph.2014.36.4.26

Center for Asian American Studies, University of Texas, https://liberalarts.utexas.edu/aas/.

Desai, Manan. The United States of India: Anticolonial Literature and Transnational Refraction / Manan Desai. (Philadelphia: Temple University Press, 2020).

Mishra, Sangay K. Desis Divided: the Political Lives of South Asian Americans (Minneapolis: University of Minnesota Press, 2016).

Shams, Tahseen.  Here, There, and Elsewhere: the Making of Immigrant Identities in a Globalized World (Stanford, California: Stanford University Press, 2020).

Sharma, Rashmi, and Roshni Rustomji-Kerns. Living in America: Poetry and Fiction by South Asian American Writers (New York, New York: Routledge, 2018).


[1] South Asian American Digital Archive, “Mission,” https://www.saada.org/mission, Accessed 9 May 2021.

Read, Hot & Digitized: Visualizing Wikipedia’s Gender Gap

Read, hot & digitized: Librarians and the digital scholarship they love — In this new series, librarians from UTL’s Arts, Humanities and Global Studies Engagement Team briefly present, explore and critique existing examples of digital scholarship.  Our hope is that these monthly reviews will inspire critical reflection of and future creative contributions to the growing fields of digital scholarship.

Wikipedia is a website that many of us use every day – yes, even us librarians! Wikipedia was founded with utopian ideals, with its democratic approach to content creation and always-free, open knowledge. Therefore, it seems like the ideal platform to address structural inequalities in our information systems that reflect and reinforce racism, misogyny, homophobia, and transphobia and combinations thereof.

However, Wikipedia has a long-standing problem of gender imbalance both in terms of article content and editor demographics. Only 18% of content across Wikimedia platforms are about women. The gaps on content covering non-binary and transgender individuals are even starker: less than 1% of editors identify as trans, and less than 1% of biographies cover trans or nonbinary individuals. When gender is combined with other factors, such as race, nationality, or ethnicity, the numbers get even lower. This gender inequity has long been covered in the scholarly literature via editor surveys and analysis of article content (Hill and Shaw, 2013; Graells-Garrido, Lalmas, and Menczer, 2015; Bear and Collier, 2016; Wagner, Graells-Garrido, Garcia, and Menczer, 2016; Ford and Wajcman, 2017). To visualize these inequalities in nearly real time, the Humaniki tool was developed.

Humaniki was created in 2020 by merging two previous data visualization projects. Data scientist Maximillian Klein created the Wiki Data Human Gender Indicators project in 2016. The French project Denelezh was created by Enzel Le Mir for Wikimedia France in 2017. Both projects utilized the Wikidata API and merged because of their significant overlap and shared mission, and Klein recently received a grant from the Wikimedia Foundation to continue this work. Humaniki is also built using Python, and its backend code is available on GitHub

Humaniki has many ways to explore this data. One of the most interesting is to look at the numbers based on language. Wikipedia isn’t just available in English, and Humaniki offers users the chance to look at gender representation for biographies in 529 languages! Another interesting data point is Year of Birth, and the trends in the Humaniki data suggest the gender gap closes slightly for biographies about younger people. For example, 23% of biographies on people born in 1963 are about women. For biographies on people born in 1983, however, 29% are about women. 

Humaniki also provides numbers of biographies on people who identify as “other genders” (people whose gender identity is not cisgender). For each metric, you can review the “Other Genders Breakdown,” which lists out all the gender identities (trans women, trans men, nonbinary, genderfluid, two-spirit, etc.) included in that particular data point. The “Other Genders” metric is important because the numbers are so stark. Looking back to our examples from 1963 and 1983, only 16 biographies in the 1963 dataset and 31 from 1983 are about people who don’t identify as cisgender – that’s out of more than 50,000 biographies! This highlights the great need to create and expand articles on people who identify outside of the traditional gender binary.

Humaniki is a useful tool for building awareness of the Wikipedia gender gap, and there are many ways to act upon this knowledge and get involved. The UT Libraries sponsors multiple Wikipedia edit-a-thons focused on improving articles about women and LGBTQ+ people. Every March, we host Queering the Record, a homegrown edit-a-thon to improve queer and trans representation, and we participate in the international campaign Art + Feminism, which focuses on gender, feminism, and the arts. Additionally, we’ve hosted one-off edit-a-thons covering Latinx and Mexican women, Indigenous languages, and women and LGBTQ+ people in STEM fields. Keep an eye on the UT Libraries events page to learn about future edit-a-thons!

Scholarship and Popular Press on the Wikipedia Gender Gap

Bear, Julia B., and Benjamin Collier. “Where are the women in Wikipedia? Understanding the different psychological experiences of men and women in Wikipedia.” Sex Roles 74, no. 5-6 (2016): 254-265. 

Filipacchi, Amanda. “Wikipedia’s Sexism Toward Female Novelists.” The New York Times, April 24, 2013. 

Ford, Heather, and Judy Wajcman. “‘Anyone can edit’, not everyone does: Wikipedia’s infrastructure and the gender gap.” Social Studies of Science 47, no. 4 (2017): 511-527.

Gordon, Maggie. “Wikipedia Editing Marathons Add Women’s Voices to Online Resource.” Houston Chronicle, November 9, 2017. https://www.houstonchronicle.com/life/article/Adding-women-s-voices-to-Wikipedia-12344424.php

Graells-Garrido, Eduardo, Mounia Lalmas, and Filippo Menczer. “First women, second sex: Gender bias in Wikipedia.” In Proceedings of the 26th ACM Conference on Hypertext & Social Media, pp. 165-174. 2015.

Hill, Benjamin Mako, and Aaron Shaw. “The Wikipedia Gender Gap Revisited: Characterizing Survey Response Bias with Propensity Score Estimation.” PloS One 8, no. 6 (2013): e65782–e65782.

Paling, Emma. “The Sexism of Wikipedia.” The Atlantic, October 21, 2015. https://www.theatlantic.com/technology/archive/2015/10/how-wikipedia-is-hostile-to-women/411619/

Stephenson-Goodknight, Rosie. “Viewpoint: How I Tackle Wiki Gender Gap One Article at a Time.” BBC News, December 7, 2016. https://www.bbc.com/news/world-38238312

“The Nobel Prize Winning Scientist Who Wasn’t Famous Enough for Wikipedia.” The Irish Times, October 3, 2018. https://www.irishtimes.com/life-and-style/people/the-nobel-prize-winning-scientist-who-wasn-t-famous-enough-for-wikipedia-1.3650212

Wagner, Claudia, Eduardo Graells-Garrido, David Garcia, and Filippo Menczer. “Women through the glass ceiling: gender asymmetries in Wikipedia.” EPJ Data Science 5 (2016): 1-24.

Behind the Numbers: UX

This post will focus on how the Assessment Team has begun officially dipping our toes into User Experience (UX) research by conducting a usability test focused on part of the main navigation of the UT Libraires website. Why, you might ask, is this assessment-focused column talking about UX?

In many ways, my assessment practice has always incorporated a good bit of user experience work, though I haven’t typically labeled it as such. Past endeavors such as dot poster surveys (used to learn how students were using new library spaces) and a branch observation project (that was interrupted by the pandemic) employed user experience methodologies, and I see user experience and assessment as complementary and overlapping approaches to asking and answering questions aimed at improving what we do.

When the Libraries redesigned our website a few years ago (which was a huge accomplishment involving many of my talented colleagues), the site redesign process incorporated user feedback by conducting A/B tests, usability tests, focus groups, and more. Now that the site has moved out of development and into sustainment, there are fewer resources devoted to conducting user tests. My colleagues have been busy producing great new tools like portals for our digital exhibits, our digitized and born-digital items, and geospatial data, but we were not sure how to best incorporate them into our site navigation. Members of the Web Steering CFT have conducted user tests as needed/possible, and the Assessment Team decided to help in the effort and take on a UX project this spring to help answer questions we had about our navigation menu choices.

A screenshot of the "Find, Borrow, Request" menu that includes links to Library Catalog, Articles, Databases, Journals, Course Materials, Collections Showcase, Digital Collections, Digital Exhibits, Maps, and Geospatial Data.

Along with a small team of other colleagues, we designed a series of questions and tasks focused on the “Find, Borrow, Request” portion of our website and recruited 10 students to participate in brief UX tests conducted through Zoom. While the pandemic has made many aspects of user research more difficult, we were easily able to recruit students through an email invitation, and were overwhelmed with the volume of interest we garnered. We just finished conducting tests earlier this week and haven’t analyzed the results yet, but I already learned through my role in conducting tests that terms like “Collections Showcase” and “Digital Exhibits” are not self-explanatory to the majority of our students. Most surprisingly, the label “Maps” (which we did not expect to be confusing) was misleading to most of the students I conducted or observed tests with. Students generally expected to find a map of library locations or library floorplans at the link, but the link actually leads to our collection of digitized maps of places all over the world. This underscores the importance of conducting frequent user testing. We never would have learned that “Maps” was confusing if we hadn’t been testing adjacent links! Clearly we need to rethink our labels.

I’m excited to analyze the full results and turn them into recommendations for improving the site. I’ve even more excited about expanding our team to include a librarian focused on UX so we can increase our ability to conduct tests like this. We just posted a position for a UX Librarian to join the Assessment and Communication Team to help us ensure that our spaces and services (both web and physical) are welcoming and functional for our users. The eventual end of the pandemic provides ample opportunity for rethinking how we have always done things, and we hope that a UX Librarian will help ensure that the changes we make help our users have great experiences at the UT Libraries.

WHIT’S PICKS: TAKE 9 – GEMS FROM THE HMRC

Resident poet and rock and roll star Harold Whit Williams is in the midst of a project to catalog the KUT Collection, obtained a few years ago and inhabiting a sizable portion of the Historical Music Recordings Collection (HMRC).

Being that he has a refined sense of both words and music, Whit seems like a good candidate for exploring and discovering some overlooked gems in the trove, and so in this occasional series, he’ll be presenting some of his noteworthy finds.

Earlier installments: Take 1Take 2Take 3Take 4Take 5Take 6, Take 7, Take 8

Acetone / Cindy

Available at Fine Arts L​ibrary Onsite Storage

Criminally-overlooked and ultimately doomed L.A. stoner garage-roots trio Acetone droned away in near obscurity during the 1990’s “alternative” heyday, but one can hear their influence on today’s wealth of indie pop and Americana music. Cindy, their first full-length, rocks hard throughout and is built upon overdriven guitars rather than the mellow Gram Parsons-esque atmospherics that would color their subsequent psych-country records. Here’s that time-travelling, road-tripping, couch-surfing soundtrack you’ve long been waiting for. 

Conrad Herwig Nonet / Sketches of Spain y mas

Available at Fine Arts Library Onsite Storage

Trombonist and bandleader Conrad Herwig takes mucho Latin Jazz liberties with this classic Miles Davis work, plus three other pieces (y mas). His New York-based nonet parties hearty in an Afro-Cuban style live at the Blue Note on Davis’ Solar, Seven Steps to Heaven, and Petits Machins, but it’s the majestic 25 minute-long epic Sketches of Spain that stands out admirably here. With highlights from trumpeter Brian Lynch, saxophonist Paquito D’Rivera, and especially the shock-and-awe back and forth between drummer Robby Ameen and conguero/percussionist Richies Flores. 

Amadou & Mariam / Wati

Available at Fine Arts Library Onsite Storage

Stretching the boundaries of traditional north African music, Amadou & Mariam unabashedly mix in healthy doses of rock, blues, pop, and funk into their full band’s hypnotic groove. Having met as students at Mali’s Institute for the Young Blind, the two became a couple, and musically involved as well. Wati leans more in a Western direction – production and instrumentation-wise – but the heart and the soul of the record comes straight from Bamako. A mesmerizing and exuberant Afro pop celebration. 

Britta Phillips & Dean Wareham / Sonic Souvenirs

Available at Fine Arts Library Onsite Storage

Another musical couple here (Britta Phillips and Dean Wareham of indie rock royalty Luna) spices things up nicely with this short and sweet six-track EP. Enlisting famed Bowie producer Tony Visconti for these revamped versions from an earlier album, the duo grooves in a downtown underground style a la Velvet Underground & Nico. Warehams’ low energy slacker vibe is baked in, but it’s Phillips’ coy and coquettish vocals icing this delightful dream pop cake. 

Shirley Scott / Memorial Album

Available at Fine Arts Library Onsite Storage

Always somewhat in the shadows of other Philadelphia B3 organ legends (Jimmy Smith, Jimmy McGriff), Shirley Scott’s exquisite soul jazz chops were nevertheless second to none. The subtitle to this collection, “Queen of the Organ” is no hyperbole, as any experienced hepcat listener can attest to. Culled from her Prestige (and other labels) recordings, these tracks showcase Scott’s solo artist virtuosity as well as her steady grooving backup session work with the likes of Eddie “Lockjaw” Davis, and her husband at the time, Stanley Turrentine. Talk about Philly soul? Then you’ve got to be talking about Shirley Scott.

[Harold Whit Williams is a Content Management Specialist in Music & Multimedia Resources. He writes poetry, is guitarist for the critically acclaimed rock band Cotton Mather, and releases lo-fi guitar-heavy indie pop as DAILY WORKER.]

plenty of fish in the sea: using dutch art to study historic biodiversity

Read, hot & digitized: Librarians and the digital scholarship they love — In this new series, librarians from UTL’s Arts, Humanities and Global Studies Engagement Team briefly present, explore and critique existing examples of digital scholarship.  Our hope is that these monthly reviews will inspire critical reflection of and future creative contributions to the growing fields of digital scholarship.

Fishing in the past” encourages us to explore the connections between artistic expression, scientific identification, and commercial practices. A crowdsourced metadata project, “Fishing in the past” asks volunteers to identify fish species represented in Dutch still life paintings from the early modern period to learn more about historical aquatic biodiversity and commercial uses of fish in Europe. The campaign is part of “A new history of fishes,” a project funded by the Dutch Research Council that includes researchers from Leiden University Centre for the Arts in Society and Naturalis Biodiversity Centre. The artwork included in the “Fishing in the past” campaign comes from the Rijksmuseum and the RKD – Netherlands Institute for Art History. The project was designed using Zooniverse, “the world’s largest and most popular platform for people-powered research.”[1] This crowdsourced approach to research has been termed “citizen science.”[2]

I discovered “Fishing in the past” while evaluating Zooniverse for possible use in the creation of a crowdsourced metadata campaign for photographs from the “Sajjad Zaheer Digital Archive.” I was intrigued by the project’s use of art to support scientific research. This is just one example of how digital scholarship tools and methods can facilitate interdisciplinary projects that propose creative solutions to existing research problems. “A new history of fishes” examines the relationship between ichthyology (the study of fish) and European history and culture, an area of inquiry that “has always been underexposed.”[3] Though quite different in subject matter, the “Sajjad Zaheer Photo Archive” and “Fishing in the past” share the objective of identifying beings (human and aquatic, respectively) in images, a belief in the value of opening up research projects to the general public, and a commitment to open access data and information. As such, “Fishing in the past” was a helpful model for my own project.

“Fishing in the past” asks members of the public to identify the species for every fish in an image. The research team provides tools to help, such as a list of common species that includes images and identifying features to assist classification. The species list can filtered by characteristic, such as color or pattern. After identifying the species, contributors are instructed to classify the commercial use of the fish, such as traded at a market or consumed on plate. They finally record the number of fish for a single species in the image. The process is repeated for each species pictured.

The “Fishing in the past” team has already shared some initial results and plans to publish further findings in an open access journal. Through crowdsourcing, this project has generated more data in a shorter period of time than could be achieved by the research team alone. Benefits for volunteers include engaging in their interests, interacting with artistic and scientific materials in new ways, and knowing that they are making a contribution to something bigger than themselves. For future researchers, crowdsourcing campaigns provide valuable data, including the ability to “read” materials with accessibility technologies.

All Zooniverse campaigns can be found here. Those interested in crowdsourced transcription work might also enjoy participating in FromThePage projects from University of Texas Libraries.

The Fine Arts Library holds catalogs that accompanied past Dutch and Flemish still life exhibitions.

Those interested in marine science should start with this LibGuide.

[1] https://www.zooniverse.org/about

[2] For an in-depth look at citizen science: Hecker, S., Haklay, M., Bowser, A., Makuch, Z., Vogel, J., & Bonn, A. (2018). Citizen Science: Innovation in Open Science, Society and Policy. University College London.

[3] https://www.universiteitleiden.nl/en/research/research-projects/humanities/new-history-of-fishes

Madeline Goebel is the Global Studies Digital Projects GRA at Perry-Castañeda Library and a current graduate student at the School of Information.

Behind the numbers: pandemic metrics

When I tell people that my job is to do assessment for an academic library, it’s not uncommon to see a brief blank stare, followed by a story about a library that made an impact on them. People know and love libraries. Assessment? Not so much. This new blog series, Behind the Numbers, will show examples and tell stories about how we use assessment at the UT Libraries to help give our users those impactful library moments.

Because it’s at the forefront of everything at the moment, I will use this inaugural post of Behind the Numbers to delve into how we’ve used assessment to help navigate the disruption to our spaces and services caused by the pandemic. When the University moved all operations online in March 2020 and we quickly changed all of our service models to a fully remote configuration, we needed a way to monitor how students, faculty, and staff were using online library services. As the pandemic continued into the Fall semester, we needed to make difficult decisions that involved limiting access to physical materials in order to retain special emergency access to those materials in digital formats through a partnership with other academic libraries called HathiTrust.

Faced with a difficult balancing act between the need to provide access to materials, spaces, and in-person support, and the need to keep our staff and community safe, we turned to available data to inform our planning. We built a basic dashboard with monthly metrics on the use of a few services that we thought might be helpful for making decisions about our physical spaces, in come cases comparing use in 2020 to use before the pandemic. The dashboard is not comprehensive of all of our services, or even our most popular services. We chose to include data points that were quickly attainable and might help us make decisions about “re-opening” physical spaces in Fall 2020.

Of note here is the line chart in the top right that compares daily usage of physical items and the digital items we’re receiving through the special HathiTrust agreement. It shows us that in general, use of the HathiTrust digital items has been on par with usage of physical library materials.

After a period of operating as an online only library, we reopened the main library with limited services and spaces and serious COVID precautions in place. We needed a way to measure safe capacity in our space to allow for adequate social distancing, so we implemented a people counter and a swipe to enter system. The people counter has software built in that allows us to monitor occupancy at any moment and look for patterns of occupancy. We have used this to make decisions about how much of the main library to make available. Through the fall semester, we learned that the main floor of PCL is large enough to safely hold all library visitors even at peak usage times.

Beyond occupancy, we wanted to know about the people who were using the physical library space. Were they students? Faculty? Were they coming often to study, or just occasionally to borrow materials? As part of a mixed methods study, we used swipe data to create visualizations that tell us how many times each unique visitor entered PCL. As you can see below, over half of the people who have visited since we reopened in Fall 2020 have only visited one or two times, suggesting that they were there to fulfill a specific need, not to study or attend classes online. We also monitor the university affiliations of our visitors, showing that the vast majority are students.

We also invited everyone who visited PCL during the Fall semester to respond to a survey with questions about perceived safety and suggestions for the Spring. We were thrilled to learn that almost 90% of survey respondents reported feeling very safe or extremely safe at PCL. This gave us further confidence that our occupancy data was helping us make good decisions.

The Assessment Team had been thinking before the pandemic about what data we might include in dynamic dashboards to help our colleagues make data-driven decisions, but COVID-19 pushed us in that direction more quickly than we planned. Stay tuned for more dashboards (and info about other methods) in posts to come.

“IT IS DULL, SON OF ADAM, TO DRINK WITHOUT EATING:” ENGAGING A TURKISH DIGITAL TOOL FOR THE STUDY OF ISLAMIC THOUGHT


Read, hot & digitized: Librarians and the digital scholarship they love — In this new series, librarians from UTL’s Arts, Humanities and Global Studies Engagement Team briefly present, explore and critique existing examples of digital scholarship.  Our hope is that these monthly reviews will inspire critical reflection of and future creative contributions to the growing fields of digital scholarship.

Over the years of my involvement in Middle Eastern and Islamic Studies (MEIS), I have become something of an advocate for learning modern Turkish. The necessity of facility with Turkish in order to conduct research in MEIS, and more importantly, to carry on scholarly communication in MEIS, grows clearer every year. I would not hesitate to argue that non-Turkish scholars ignore Turkish scholarship at their own peril—it is that central, plentiful, and informative. An excellent example of a scholarly development out of Turkish academe that would be quite useful for MEIS pedagogy and research is İslam Düşünce Atlası, or The Atlas of Islamic Thought. It also happens to be an incredible digital Islamic Studies scholarship initiative.

İslam Düşünce Atlası (İDA) is a project of the İlim Etüdler Derneği (İLEM)/Scientific Studies Association with the support of the Konya Metropolitan Municipality Culture Office. It is coordinated by İbrahim Halil Üçer, with the support of over a hundred researchers, design experts, software developers, and GIS/map experts. The goal of the project is to make the academic study of the history of Islamic thought easily accessible to scholars and laypeople alike through new (digital) techniques and within the logic of network relations. İDA has been conceived as an open-access website with interactive programs for a range of applications. Its developers intend it to contribute a digital perspective to historical writing on Islam: a reading of the history of Islamic thought from a digitally-visualized time-spatial perspective and context.

İDA features three conceptual maps that aim to visualize complex relationships and to establish a historical backbone for the larger project of the atlas: the Timeline (literally time “map,” which is a more signifying term for the tool, Zaman Haritası), the Books Map (Kitaplar Haritası), and the Person Map (Kişiler Haritası). It also proposes a new understanding of the periodization of Islamic history based on the development of schools of thought (broadly defined) and their geographic spread. İDA endeavors to answer several questions through these tools: by whom, when, where, how, in relation to which school traditions, through what kinds of interactions, and through which textual traditions was Islamic thought produced? Many of these questions can be summed up under the umbrella of prosopography, and in that arena, İDA has a few notable peer projects: the Mamluk Prosopography Project, Prosopographical Database for Indic Texts (PANDiT), and the Jerusalem Prosopography Project (with a focus on the period of Mongol rule), among others.

One of my favorite aspects of İDA is the book map and its accompanying introduction. The researchers behind İDA do their audience the great service of explaining the development and establishment of the various genres of writing in the Islamic sciences. Importantly, they also link the development of these genres to the periodization of Islamic history that they propose. The eight stages of genre development that are identified—collation/organization, translation, structured prose, commentary, gloss, annotation, evaluative or dialogic commentary, and excerpts/summaries—share with the larger İDA project their origin in scholarly networking and relationship building. By visualizing the networks of Muslim scholars, as well as the relationships among their scholarly production and the non-linear, multi-faceted time “map” of Islamic thought, İDA weaves together the disparate facets of a complex and oft willfully misunderstood intellectual tradition

I encourage readers not only to learn some modern Turkish in order to make full use of İDA (although Google translate will work in a pinch!), but also to explore threads throughout all of the visualizations: for example, trace al-Ghazālī’s scholarly network, and then look at that of his works. What similarities and differences do you notice? Is there a pattern to the links among works and scholars? Readers who are interested in the intellectual history of Islam should check out my Islamic Studies LibGuide, as well as searches in the UT Libraries’ catalog for some of their favorite authors (see here for al-Ghazālī/Ghazzālī, Ibn Sina/Avicenna, and Ibn al-Arabi).